Survey question types explained: Examples and expert tips
Effective surveys start with asking the right questions. When you understand the different types of survey questions, you’ll be able to gather the most insightful, actionable data from your respondents.
Whether you’re conducting academic research, improving customer satisfaction or boosting employee engagement, creating a well-designed survey is key to gathering actionable insights.
The types of questions that you ask in a survey play a crucial role in collecting accurate, relevant data. Different question types can yield varying levels of detail, accuracy and engagement from respondents.
In this article, we’ll explore common types of survey questions, from multiple choice to Likert scale questions, and offer examples and expert tips on how to use each for the best results. By understanding the nuances of these question formats, you can design surveys that not only capture the data you need but also enhance the overall respondent experience.
Types of survey questions
Creating an effective survey involves selecting the right types of questions to gather the data you need. Below is a summary of the most commonly used survey question types and when to use them.
| Type of survey question | Description | When to use |
| Multiple choice questions | Ask respondents to select one or more options from a predefined list of answers. | Quantifying responses, simplifying analysis and allowing for easy comparison. |
| Rating scale questions | Provide a numerical scale for respondents to indicate their level of agreement, satisfaction, frequency or other relevant factors. | Measuring the intensity of opinions, attitudes or behaviours. |
| Likert scale questions | Offer a range of response options along a continuum, typically from “strongly agree” to “strongly disagree”. | Gauging attitudes and opinions across a spectrum. |
| Matrix questions | Present a series of Likert or rating scale questions arranged in a grid or matrix format. | Evaluating multiple items using the same set of response options. |
| Dropdown questions | Present a list of answer options in a dropdown menu format. | Providing a long list of options in a compact format. |
| Open-ended questions | Prompt respondents to provide free-form, unrestricted responses. | Collecting detailed, qualitative insights. |
| Demographic questions | Gather information about respondents’ personal attributes, such as age, gender, education, income, ethnicity, marital status and geographic location. | Segmenting data according to demographic characteristics. |
| Ranking questions | Ask respondents to prioritise or order a list of items or options. | Understanding preferences and relative importance. |
| Image choice questions | Present visual images as answer options. | Enhancing engagement and understanding preferences visually. |
| Click map questions | Show an image, diagram or map and ask respondents to click on specific areas of it. | Collecting spatial data and preferences related to visual content. |
| File upload questions | Allow respondents to submit files, such as documents, images, videos or audio recordings. | Gathering supplementary materials and detailed responses. |
| Slider questions | Include a visual sliding scale for respondents to adjust in order to indicate their level of agreement, satisfaction or other quantitative measures. | Measuring continuous data in an interactive format. |
| Benchmarkable questions | Gather data that can be compared against established benchmarks or standards. | Assessing performance relative to predefined criteria or industry norms. |
| Dichotomous questions | Offer only two response options: typically “yes” or “no”; or “agree” or “disagree”. | Eliciting clear, binary answers that are easy to analyse. |
Keep reading for a more in-depth exploration of the most common types of survey questions and to learn how they can be effectively utilised to gather valuable insights.
Multiple choice questions
What are multiple choice questions?
Multiple choice questions are the most popular survey question type. They allow your respondents to select one or more options from a list of answers that you define. They’re intuitive, help produce easy-to-analyse data and provide mutually exclusive choices. Because the answer options are fixed, your respondents have a more effortless survey-taking experience.
Perhaps, most importantly, you’ll receive structured survey responses that produce clean data for analysis.
Examples of multiple choice questions

Multiple choice questions come in many different formats. The most basic variation is the single-answer multiple choice question. Single-answer questions use a radio button format (circle buttons representing options in a list) to allow respondents to click only one answer. They work well for binary questions, questions with ratings or nominal scales.
Multiple-answer multiple choice questions are commonly shown with square tick boxes. They allow respondents to tick all of the answer options that apply to them.
For example, “In which of the following ways do you use our product?”
- As part of a project or assignment
- As a tool for research
- For entertainment purposes
- To enhance productivity
- To solve specific problems
Limitations of multiple choice questions
A common drawback of multiple choice questions is that they force you to limit responses to a predetermined list of options, which can cause bias in your results. What if none of your answer options apply to your respondents? They might just choose a random answer option, which could have an impact on the accuracy of your results.
You can solve this problem by adding an “other” answer option or comment field. It should be listed at the end of all your choices. When respondents see it, they will know they have the option of answering your question in their own words instead of yours.
Rating scale questions
What are rating scale questions?
In rating scale questions (sometimes referred to as ordinal questions), the question displays a scale of answer options from any range (0 to 100, 1 to 10, etc.). The respondent selects the number that most accurately represents their response.
Examples of rating scale questions
Net Promoter Score® questions are a good example of rating scale questions. They use a scale to gauge how likely it is that customers would recommend your product or service.

Tips for crafting effective rating scale questions
With ranking questions and numerical rating scales, it’s important to give the respondent some context. For instance, imagine you asked the question “How much do you like ice cream?” If you don’t explain the value of the numbers on your scale, a numerical rating scale might not make much sense.
Likert scale questions
What are Likert scale questions?
Chances are you’ve seen this question type before. Likert scale questions are the “Do you agree or disagree?” questions that you often see in surveys and are used to gauge respondents’ opinions and feelings.
Examples of Likert scale questions
Likert scale questions give respondents a range of options, for example starting at “not at all likely” and scaling up to “extremely likely”. That’s why they work well to understand specific feedback. For example, survey questions for employees often use a Likert scale to measure their opinions or attitudes on a range of topics.

Related reading: Likert scale survey questions, examples and mistakes to avoid
Matrix questions
What are matrix questions?
If you want to ask a few questions one after the other that have the same response options, matrix questions are your best option. A series of Likert scale questions or a series of rating scale questions can work well as a matrix question.
Tips for crafting effective matrix questions
Matrix questions can simplify a lot of content, but it’s important to use them carefully. Very large matrices, like the one below, can be confusing and difficult to take on mobile devices.
If the matrix becomes too complex or lengthy, consider breaking it down into smaller, more manageable sections or alternative question formats, such as dropdown menus or multiple choice questions.

Dropdown questions
What are dropdown questions?
The dropdown question is an easy way to display a long list of multiple choice answers without overwhelming your respondents. By using this, you can give them a scrollable list of answers to choose from.

When to use dropdown questions
Sometimes, showing all answer options at once can offer your respondents useful context about the question. Bear that in mind whenever you consider using more than one dropdown question in your survey.
Open-ended questions
What are open-ended questions?
Open-ended survey questions require respondents to type their answers into a comment box and they don’t provide specific preset answer options. Responses are then viewed individually or by text analysis tools.
Advantages and limitations of open-ended questions
When it comes to analysing data, open-ended questions aren’t the best option. It’s not easy to quantify written answers, which is why text boxes are better for providing qualitative data. Allowing your respondents to offer feedback in their own words could help you uncover opportunities that you may have otherwise overlooked. However, if you’re looking for data to analyse, you may want to engage in some quantitative marketing research and utilise closed questions.
Tips for crafting effective open-ended questions
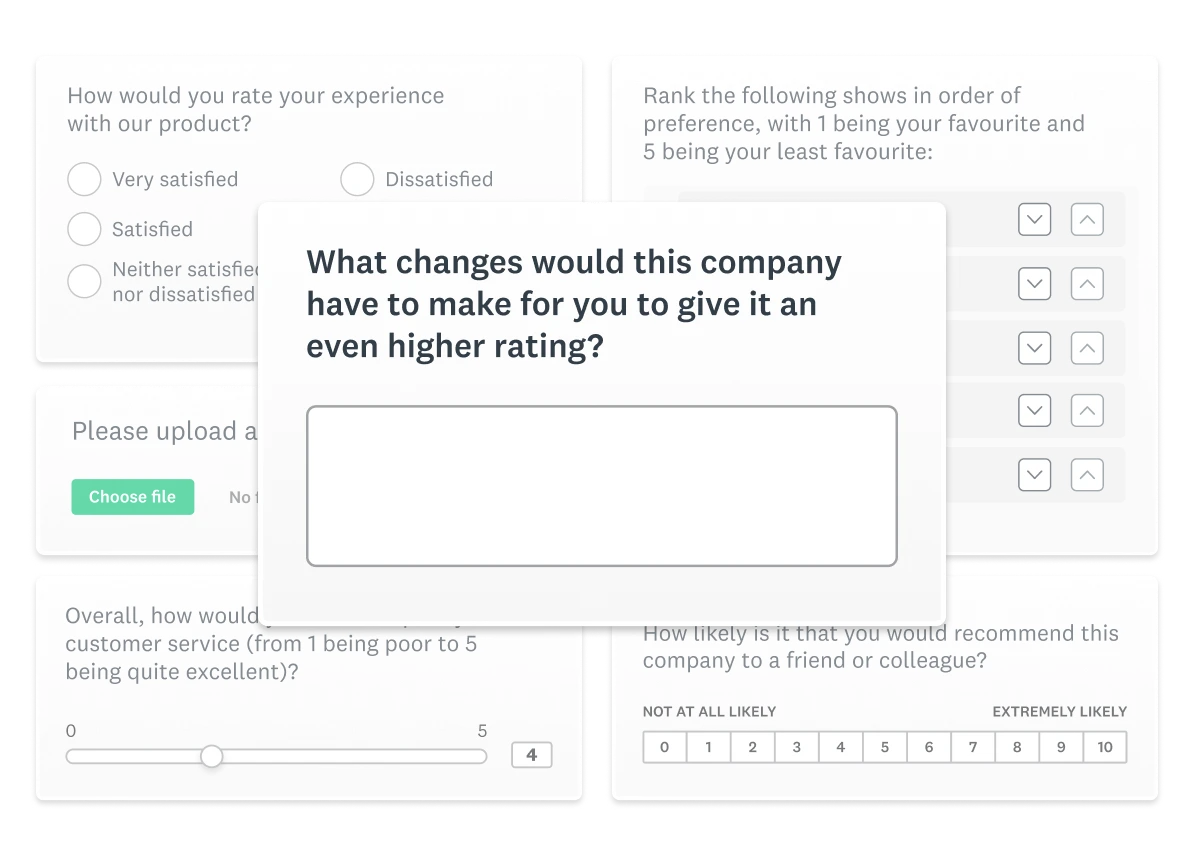
Pair closed-ended questions with open-ended ones to understand and address your quantitative data more effectively. For example, after the Net Promoter Score survey question, you can ask respondents for the reason behind their score:

Demographic questions
What are demographic questions?
Use demographic survey questions if you’re interested in gathering information about a respondent’s background (e.g. income level, age, location). When properly used, these types of questions in a questionnaire will give you better insights into your target audience.
Demographic questions are powerful tools for segmenting your audience based on who they are and what they do, allowing you to take an even deeper dive into your data.
Examples of demographic questions
Typical demographic questions ask for information such as age, gender, relationship status and occupation.

Ranking questions
What are ranking questions?
A ranking question asks respondents to order answer choices according to preference. This allows you to not only understand how respondents feel about each answer option, but it also helps you understand each one’s relative popularity.
When to use ranking questions
It’s important to bear in mind the fact that ranking questions can take more time to answer. So try not to use them if other question types can provide the data you need. Also, only use them when you’re confident that respondents are familiar with each answer option; otherwise, they’ll be nigh on impossible to answer accurately and honestly.
For instance, in the question below, respondents need to be familiar with each TV show before they can compare them.

Image choice questions
Our image choice question type allows you to use images as answer options. This works really well when you want respondents to evaluate the visual qualities of something, such as an ad or a logo.

Click map questions
Want to get real-time, gut-reaction feedback about an image? If so, use a click map question. Add an image to your survey and ask survey-takers to click a certain spot on the image. For example, you could ask which item on a shelf is most appealing or which part of your website is most user-friendly.
File upload questions
Need respondents to upload their CV? A headshot? Their ID? You can collect whatever you need as a PDF, PNG or doc file, and when your responses come back, you can easily download the files.

Slider questions
With a slider question, respondents can evaluate something on a numerical scale. The questions are interactive, which can make them fun to answer, and they allow you to quantify respondent sentiment at both an individual and aggregate level.

Benchmarkable questions
Benchmarkable questions aren’t necessarily presented in a specific format, but they’re special in that they allow you to compare yourself to other survey creators who asked the same question.
There is a wide range of benchmarkable questions and they can be used for different audiences (employees, customers, etc.). To find one for your survey, you can either use our question bank or one of our survey templates. If a question has a small bar chart icon at the top, this means that it’s benchmarkable.
Dichotomous questions
Dichotomous questions are incredibly straightforward in that they give you just two answer options: usually “yes” or “no”; or a choice between two different things. These questions are characterised by their binary nature, offering respondents a clear and simple choice between two options. For example:

Qualitative vs. quantitative questions
What are qualitative questions?
Qualitative questions focus on gathering descriptive or narrative information from participants. They seek stories, opinions or explanations directly from the source. Open-ended questions are the most commonly used qualitative question types in surveys. The qualitative data collected from these questions is typically textual and non-numerical.
For example, you might ask your customers “What do you think about our new product?” or “Can you describe your experience with our customer service team?”
When to use qualitative questions
Qualitative questions are useful for exploring issues that cannot be easily summarised with numbers alone or for tapping into people’s feelings, attitudes and perceptions. However, qualitative data cannot be easily quantified and are often context-specific, meaning that they may not be representative of broader populations or trends.
What are quantitative questions?
Quantitative questions focus on numbers and measurements. They provide options for responses, such as rating scales or multiple choice questions. Quantitative data, consisting of numerical values, can be statistically analysed.
Examples of quantitative questions include:
- “On a scale of 1 to 10, how satisfied are you with our service?”
- “How many times per month do you use our product?”
- “Have you ever attended any of our events?”
When to use quantitative questions
When you want to assess specific attitudes or perceptions in a standardised and measurable way, quantitative questions allow you to collect numerical data that can be analysed statistically. They are ideal for measuring the frequency, intensity or magnitude of behaviours, experiences or events.
However, quantitative questions typically provide predefined response options or scales, which can limit respondents’ ability to express nuanced or complex opinions, potentially leading to a shallower understanding of respondents’ perspectives compared to qualitative questions.
How to write good survey questions
Now that you have seen examples of the various survey question types, you’re ready to start creating your survey. Here’s some advice to bear in mind as you begin:
Use expertly designed survey questions
Creating a great survey doesn’t have to be difficult. Leverage our hundreds of free, expert-designed survey templates built by in-house subject matter experts and survey scientists. If you prefer to create a survey from scratch, use our Question Bank to start populating your survey with ready-made questions that can help you get the answers you need. This will ensure that your survey is methodologically sound and yields unbiased results.
Ask mobile-friendly questions
Are your surveys ready to go mobile? Approximately three in 10 people taking SurveyMonkey surveys in the U.S. do so on a smartphone or tablet.
Here’s a quick checklist to ensure that your survey is mobile-optimised:
- Use mainly multiple choice questions in your survey.
- Limit the number of questions on each page.
- Keep surveys as short as possible to minimise dropouts.
- Only require responses to your most important questions.
- Keep survey formatting simple, avoiding progress bars or logos as they take up valuable space.
- Avoid using images as they take up valuable space on small screens.
- Test your survey on different mobile devices.
- Keep your survey URL short and easy to read so it can be linked anywhere.
Be clear and specific
Avoid jargon, technical terms or complex language that might confuse respondents. Ensure that each question is clear and focused on one topic at a time to avoid ambiguity.
Avoid leading questions
Craft questions that do not lead or influence respondents towards giving a particular answer. Instead of asking “How great was your experience with our customer service?”, ask “How would you rate your experience with our customer service?”
Combine qualitative and quantitative questions
Sprinkle in some open-ended questions alongside your numerical ones. Such a combination allows respondents to provide additional context or elaborate on their responses. This can uncover valuable insights and enrich your data.
See what others think of your survey
We can all benefit from someone proofreading our work, and surveys are no exception.
Share your survey with colleagues, friends, family and anyone else who has a vested interest in its success before you send it. Who knows? They might be able to help you spot some errors or areas for improvement!
It’s important to know which survey question type to use and when to leverage it. Once you’re familiar with different survey questions, you’ll be able to focus on what you need from respondents, resulting in far better data.
Pretest questions
Before launching your survey, pretest questions on a small sample of respondents to identify any issues with wording, comprehension or response options. Use feedback to refine and improve your questions.
Create more effective surveys
Ready to level up your survey game? Dive into our template gallery, where we’ve curated a collection of expertly designed surveys and survey questions to help you gather valuable insights and make informed decisions.
Whether you’re exploring customer satisfaction, employee engagement or market research, we’ve got you covered with a variety of templates to suit your needs.

SurveyMonkey 101: Building your first survey
Join our free webinar and learn survey design fundamentals, AI-powered creation and collaboration best practices.
NPS, Net Promoter and Net Promoter Score are registered trademarks of Satmetrix Systems, Inc., Bain & Company and Fred Reichheld.
Discover more resources

Customer satisfaction survey templates
Explore our customer satisfaction survey templates to rapidly collect data, identify pain points and improve your customer experience.

See how Ryanair collects customer insights at scale
Discover how Ryanair uses SurveyMonkey and its Microsoft Power BI integration to track 500k monthly CSAT surveys and improve customer experiences.

How to identify customer needs
Refine your market research approach with our guide to identifying customer needs and what UK shoppers are looking for in 2024.

See how woom enhances its employee and customer experience
Discover how woom uses SurveyMonkey to launch multilingual surveys at scale, improve the employee experience and capture customer insights.