Powerful analysis, supercharged with AI
Uncover insights, spot trends and get to the “why” behind your data in minutes rather than hours.
Trusted by 260K+ organisations worldwide


Gain a clear understanding so you can drive the right outcomes, with advanced analysis features

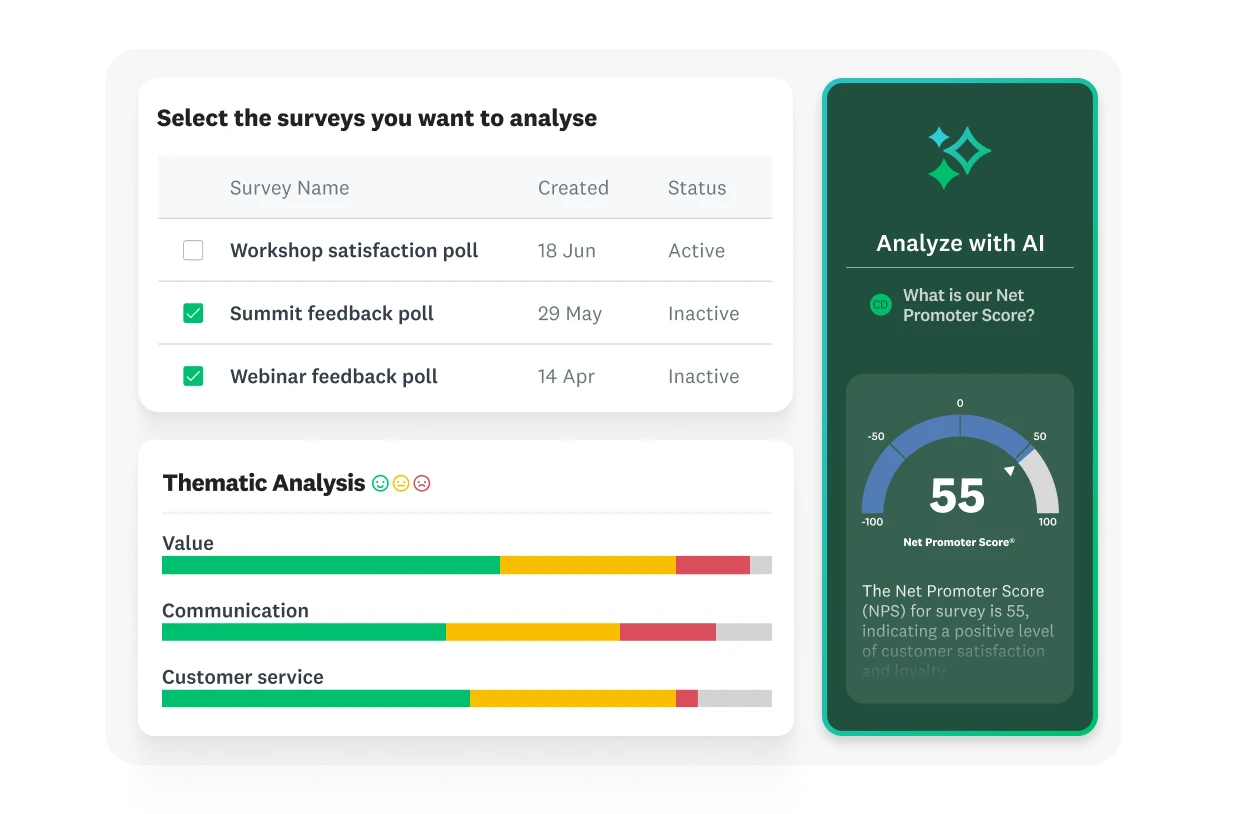
Meet your new AI survey analyst
Our new collection of AI-powered features helps you understand your data at a deeper level. Ask questions about your results, automatically find themes in open-ended feedback and uncover missed insights by using AI.
Ask any question, get instant answers
Go from wondering to knowing in seconds. When you analyse with AI, you can ask questions about your data in plain language and, in response, receive easy-to-understand summaries and charts; no complicated filters or spreadsheets required.
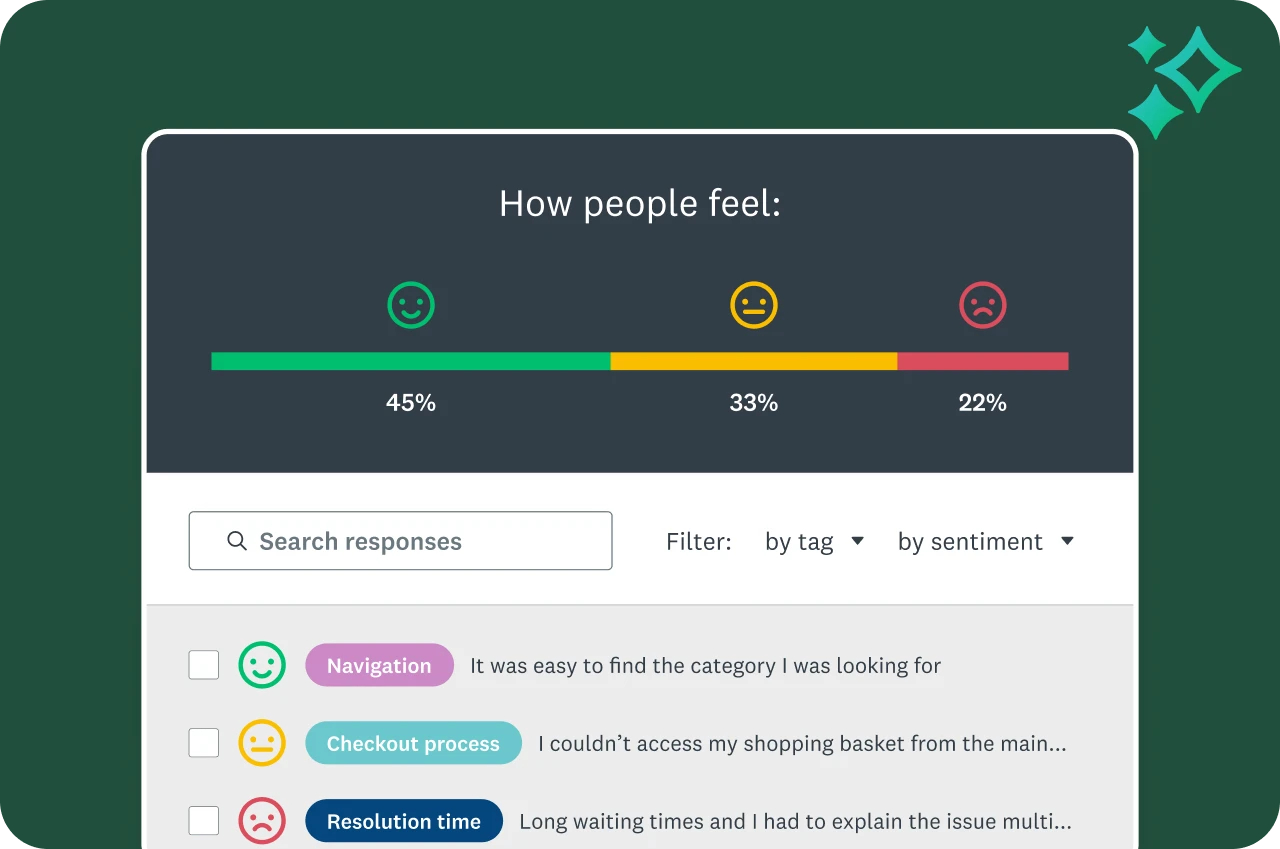
Uncover themes in open-ended text
Thematic analysis automatically discovers key topics from your written responses, while Sentiment Analysis gauges the emotional tone. You’ll understand what people are saying and how they feel in a fraction of the time.
Make decisions with confidence
Great analysis starts with reliable data. Response Quality uses AI to automatically flag suspicious or low-effort responses, helping you to focus on high-integrity feedback so you can make your next move with conviction.
Gain better insights and identify gaps to improve ROI quickly
Easily view and interpret results and dig deeper into your data to address growth gaps.
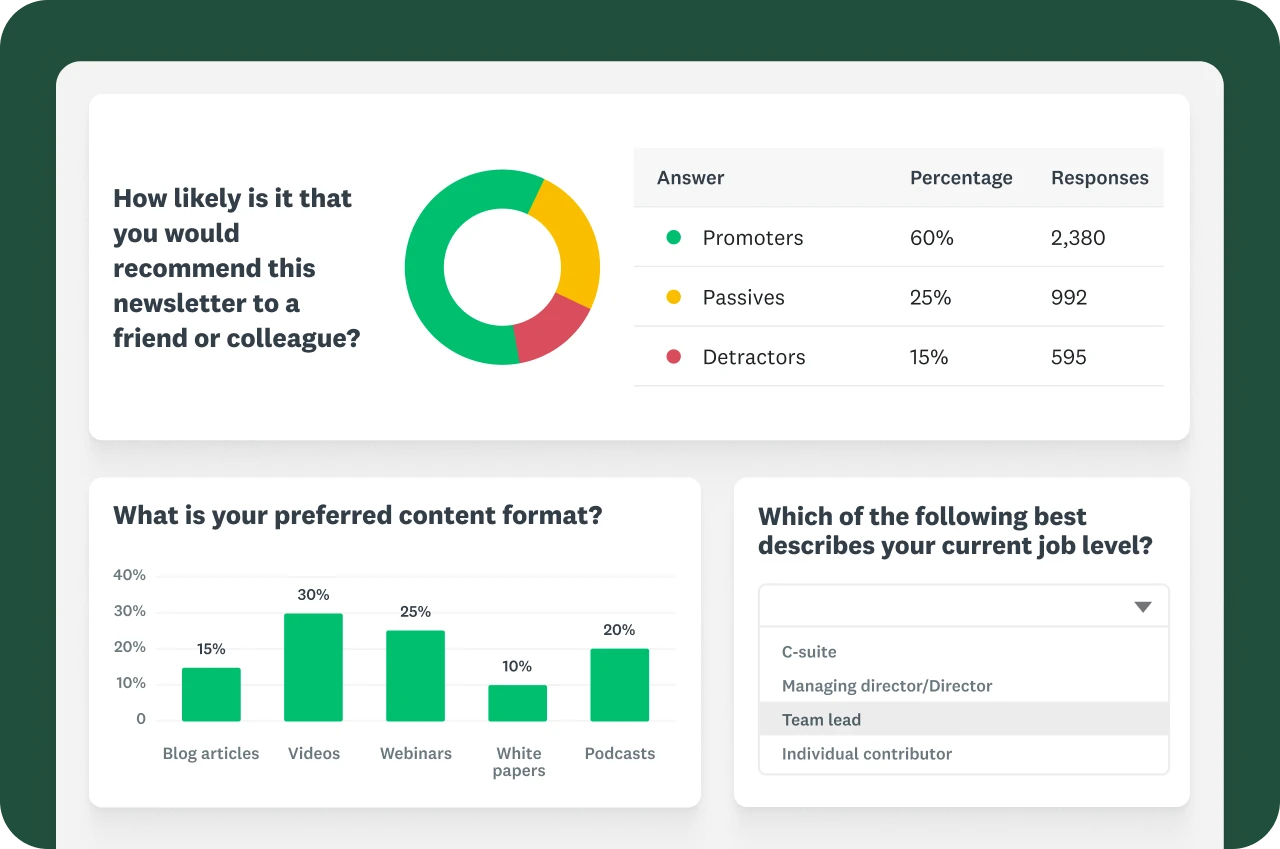
Quickly see summary and individual data
Explore real-time results, view individual responses and automatically generate charts to help you easily understand and act on data.
Filter and compare results
Filter by answer, collector, time and crosstabs. Compare results with combined filters, including similar question and answer types.
Identify meaningful insights
Easily determine whether your data has meaningful differences with statistical significance, and leverage custom variables to link survey responses to metadata and other relevant information.
Tell impactful data-driven stories
Create custom reports and dashboards that provide the data-driven insights you need to take action.
Build compelling data stories fast
Easily create and customise charts and tables that will help people across your organisation understand the insights from your surveys.
Create custom multi-survey dashboards
Use Multi-Survey Analysis to combine and analyse data across multiple surveys, monitor key metrics over time and consolidate findings in an interactive dashboard.
Explore our entire library of templates
Create, launch and collect responses faster with our expert-written templates.
See how SurveyMonkey’s analysis features empower teams across an organisation

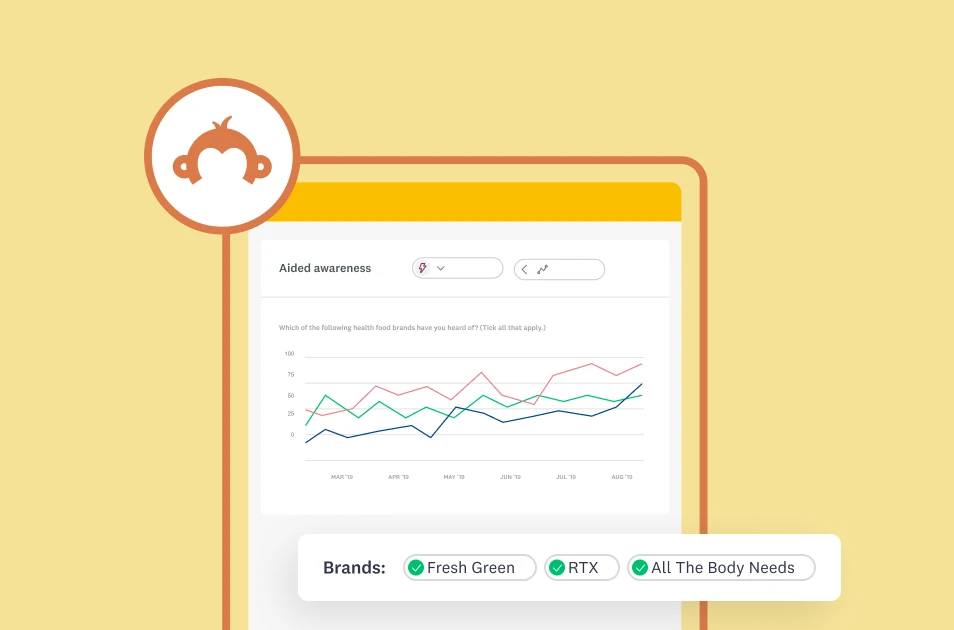
Empower your marketing team to analyse data for better results
Gain the timely insights you need to drive growth, boost ROI and inform brand strategy. Pressure-test ideas fast and get instant market feedback on products, ads, marketing messaging and more.


Get started with one of our most popular plans
Try it now and get 25 responses for free, or choose from our top plans.
*Additional charges apply for extra responses. SurveyMonkey Audience panel responses are sold separately.
Discover more about our products

Unlock customer satisfaction (CSAT) with AI and automation
Tap into CSAT feedback faster using automation and AI features.
Analyse survey data
Learn best practices and see FAQs about data analysis on the SurveyMonkey platform.
Explore all of our AI features
Learn how quick and easy it is to create and analyse surveys using SurveyMonkey AI.

Turn survey results into slick presentations
Learn how you can easily turn all your data points into concise and compelling data stories for your stakeholders.
Gain the insights you need to drive growth and innovation for your organisation
NPS, Net Promoter and Net Promoter Score are registered trademarks of Satmetrix Systems, Inc., Bain & Company and Fred Reichheld.