Interval scale: What it is and how to use it in your survey questions

The more exact your survey data is, the easier it is to analyse and apply to real-life issues. Whether you’re collecting information about political beliefs or customer satisfaction, the best way to obtain exact data is to use a numbered scale. Interval scales are used in lots of ways outside of surveys, but they’re perfect for helping you generate mathematical data from opinion and feedback surveys. Let’s go through how to use them effectively.
What is the definition of an interval scale?
An interval scale is any range of values that have a meaningful mathematical difference but no true zero. These include everyday measurement systems such as Celsius and Fahrenheit, which have set interval variables (degrees) but arbitrary zero values. For example, zero degrees in either temperature scale isn’t absolute zero, i.e. the lowest theoretically possible temperature.
That’s what makes interval scales different from ratio scales, such as Kelvin, which have an absolute zero value. Ratio scales are more useful in mathematics because it’s easier to work with absolute values than relative ones. Interval scales are sometimes useful in statistics because they allow you to assign numerical values to arbitrary measurements, such as an opinion.
Although both can measure perception or opinion, an interval scale is different from an ordinal scale, which is made up of relative values that don’t have a mathematical difference. When you ask whether it’s hot, warm or cold outside, you’re using an ordinal scale. When you ask what the temperature is, you’re using an interval scale.
An interval scale is also different from a nominal scale, which is made up of responses that don’t have exact or relative values. When you ask someone to select a meal from a menu, you’re using a nominal scale. When you ask someone to rate their meal on a scale of one to ten, you’re using an interval scale.
How do you use an interval scale?
Any survey question where the respondent must enter a temperature value, time or date technically includes an interval scale, since degrees, hours and days are all interval measurements. This means that you can easily insert an interval scale into any multiple choice question or rating scale question. You just need to ask respondents to rate something using a numerical scale.
Examples of interval scales
The Net Promoter Score® (NPS®) question measures how likely it is that the respondent would recommend a company, product or service. Like any good interval scale question, this one makes it obvious which response corresponds with which end of the scale:
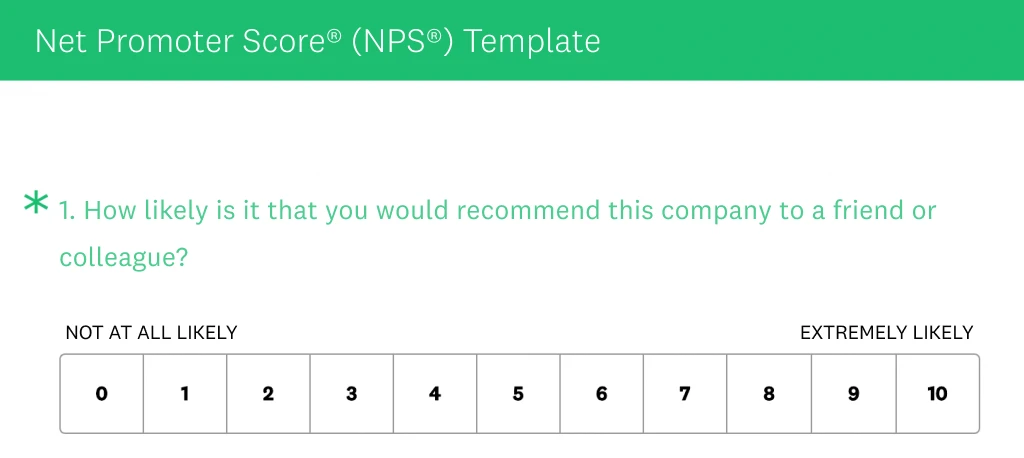
NPS, Net Promoter and Net Promoter Score are registered trademarks of Satmetrix Systems, Inc., Bain & Company and Fred Reichheld.
This question, from the CAHPS® Health Plan Survey 5.0 (Adult) Survey Template, measures how satisfied a respondent is with their health care plan. Although this scale includes a zero value, the zero value is arbitrary since it’s likely that each respondent’s definition of “worst health care possible” is different:

In our question bank, you’ll find numerous other survey questions that use interval scales to measure a wide range of opinions. But we’ll walk you through how to write them on your own, too.
How do you create an interval scale?
Here’s how to add an interval scale question to your survey:
- From the SurveyMonkey dashboard, click CREATE SURVEY or choose to edit an existing survey.
- Select DESIGN SURVEY.
- Drag and drop a new rating scale, Net Promoter Score®, multiple choice question or slider question into your survey from the BUILDER section.
- Enter (or edit) the question text. Make it obvious which response (positive or negative) corresponds with which end of the scale.
- Adjust the settings under the Edit and Options tabs. If you’re using a rating scale question, make it a single-row rating scale.
How do you interpret interval scale results?
Some questions, such as the NPS question, have unique methods and scales for interpreting their results. But an interval scale doesn’t always generate more useful data, particularly if the measurement system it uses is highly arbitrary. It does, however, enable you to calculate the mean of an aggregate data set, which you can’t do with an ordinal scale.
Ready to put the full force of analytics behind your interval scale question results? SurveyMonkey enables you to automatically calculate your basic statistics. This means that you can calculate the mean, median and mode of your interval scale questions with the click of a button.
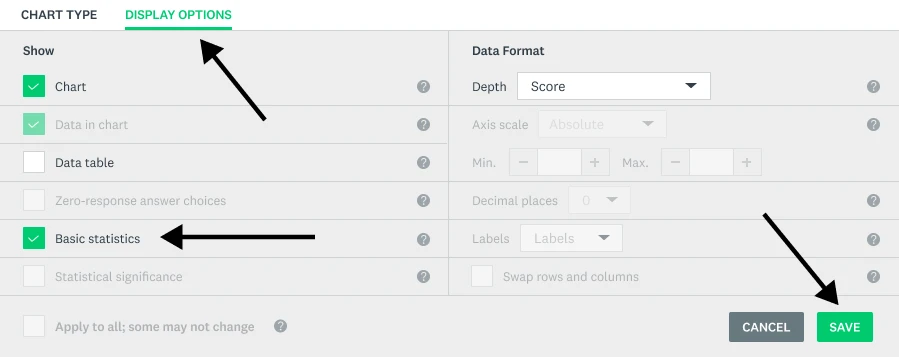
To view your basic statistics from the results of a given question, follow these steps:
- Click on Customise (above the question you’re interested in).
- Click on DISPLAY OPTIONS.
- Tick Basic statistics.
- Hit SAVE.
Bear in mind the fact that the more arbitrary your interval scale is, the less useful your data will be. While a constant interval variable is a necessary part of any interval scale, it’s difficult to keep the interval variable constant when you’re measuring opinion. Even widely used interval scales, such as the pain intensity numeric rating score (i.e. “Rate your pain on a scale of 1 to 10.”), have only modest accuracy.
When used carefully, an interval scale can add powerful mathematical significance to your opinion and feedback surveys. Dive deeper into your survey data by incorporating interval scales into your next questionnaire.
See how SurveyMonkey can power your curiosity
Discover more resources

Solutions for your role
SurveyMonkey can help you do your job better. Discover how to make a bigger impact with winning strategies, products, experiences and more.

Launch Winning Brands and Spot Trends Fast With Market Research Solutions
Learn how our market research platform can help you collect quality data. Discover our online panel and purpose-built solutions.

When you need to ask follow-up questions
Follow-up questions are a great tool to gather more insightful, specific data from surveys. Here's how and when you need to ask follow up questions.

Travel survey questions: 40+ examples to improve guest and traveller feedback
Use these 40+ travel survey questions and templates to collect feedback, boost guest satisfaction, and improve every traveller’s experience.