Combine and analyse results from different surveys in one single view
Do you ever feel like you're drowning in survey data, but can't quite connect the dots? In a business climate where insights are essential to deliver better experiences, who has the time to sift through multiple data sources and dashboards? With feedback coming from all directions, analysing the data and sharing it across teams has become a real challenge.
That's why we're thrilled to now offer multi-survey analysis, our most-requested analysis feature by SurveyMonkey Enterprise users. Think of it as a one-stop shop for making sense of all those responses.
What’s the big idea behind multi-survey analysis?
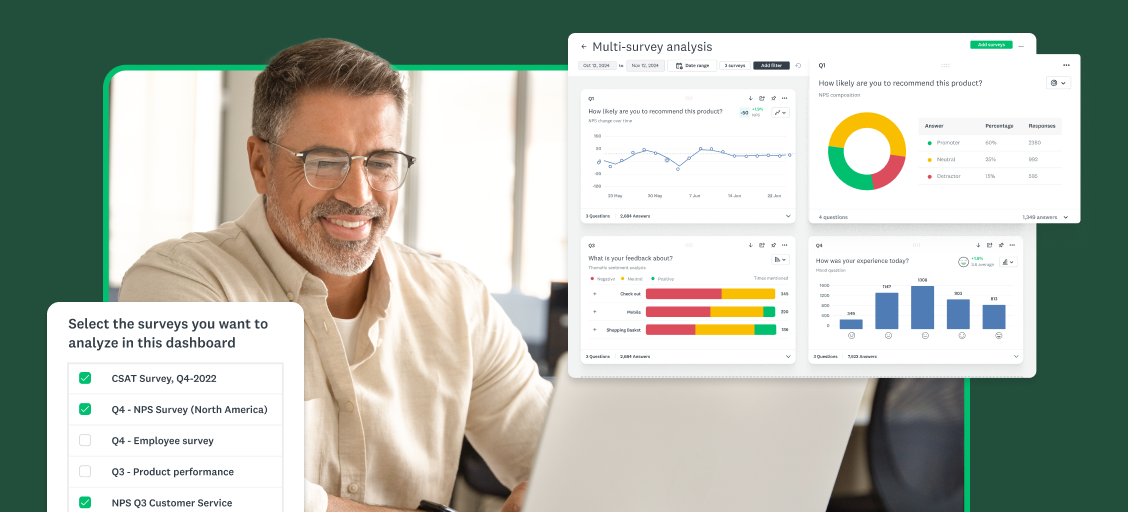
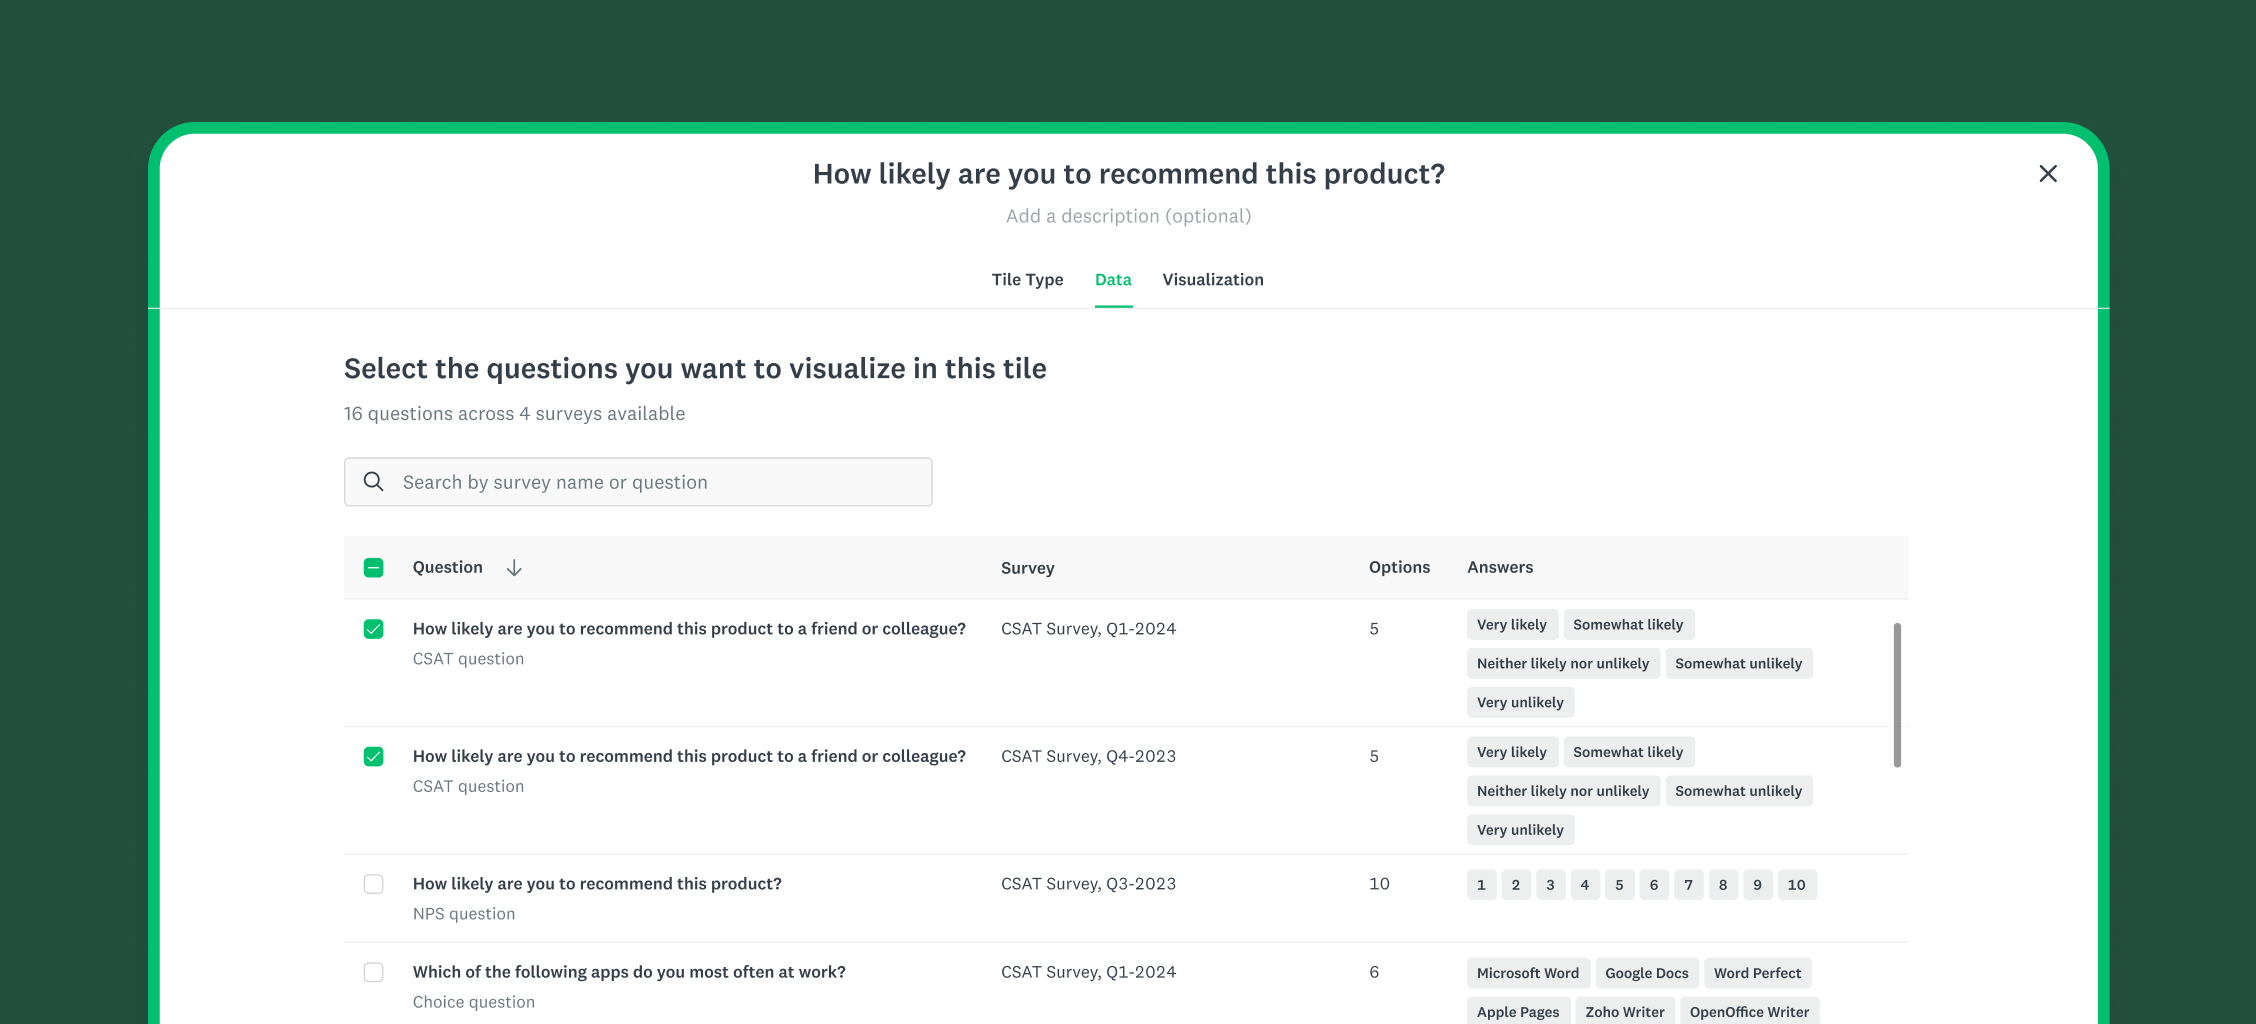
Our new multi-survey analysis feature is designed to help you bring hidden insights into focus, while saving time and building a compelling narrative through data. You’ll be able to aggregate data across similar questions from multiple surveys into one chart and view data from all the surveys you choose in one flexible, interactive dashboard. Gone are the days of switching between tabs or juggling spreadsheets. All your data is consolidated in one place for efficient analysis.
Track data changes over time (longitudinal analysis), across different brands, groups or audience segments. Would you like to see how customer satisfaction has evolved since last quarter, or how brand perception differs between demographic groups? Now you can access these insights quickly and easily.
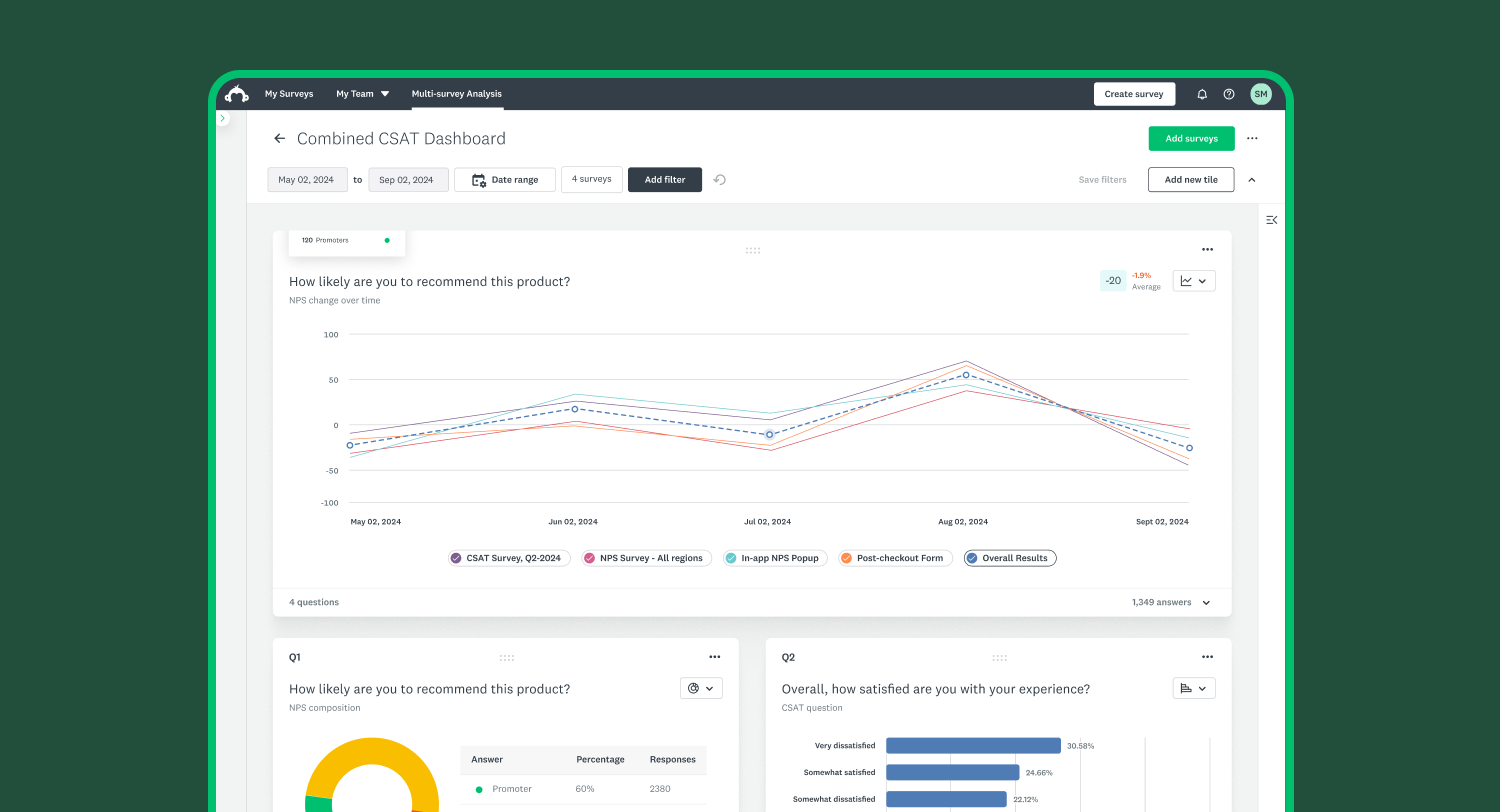
You can even pin your custom, interactive charts to SurveyMonkey dashboards. And because we understand the importance of collaboration, we've streamlined the process of sharing these with your team or stakeholders via a public link.
The power of multi-survey analysis
Multi-survey analysis is a game-changer for your feedback analysis workflow, saving you time and unlocking deeper insights. Here's what you can expect:
- Never miss an insight, even across multiple surveys: Multi-survey analysis breaks down barriers between your data sets, so you can spot patterns that would be impossible to see in isolation. For example, you might discover links between customer satisfaction, product usage, and support ticket volumes, driving targeted improvements in your offerings. These deeper insights enable more informed decision-making, transforming data from isolated points of information into a rich web of actionable intelligence.
- Save time by analysing all data under one platform: Say goodbye to the tedious back-and-forth between multiple platforms and analysis tools. Now all relevant data from various surveys can come together in one unified dashboard. This consolidation reduces the time spent on data management and further streamlines your workflow by offering a solid foundation of pre-populated dashboards. By simplifying your data analysis process, you can focus on discovering actionable insights and less on managing disparate data sources.
- Tell better data stories with dashboards: It’s not enough to have data, it’s what you do with it that matters. Multi-survey analysis provides easy-to-understand visualisations that make data analysis simple for users of all skill levels. Provide relevant context to feedback trends and build a narrative by showcasing your findings in an intuitive, seamless way. By bringing all relevant data together in one dashboard with modern data visualisations, you can tell a compelling story, making it easier to align with stakeholders and partners.
Who should use multi-survey analysis?
Multi-survey analysis isn’t just for the data experts—it's for anyone who needs to get next-level insights from survey results to drive decision-making. Whether you're a marketer trying to understand impact across different campaigns, a CX professional tracking satisfaction levels over time, or an HR leader aggregating employee engagement across department-level surveys, our feature is designed to handle complex data needs.
Ready to turn your data deluge into a stream of insights?
Try it now to see what multi-survey analysis can do for you.
Remember, our multi-survey analysis feature is only available to users on our annual paid plans, so if you have a free account, consider upgrading to get started.