It’s game time
Ready for game day? We’ve got the stats, party planning aids, and team spirit to get you hyped for the battle ahead.

92% of sports fans feel a sense of community with other fans of the same team

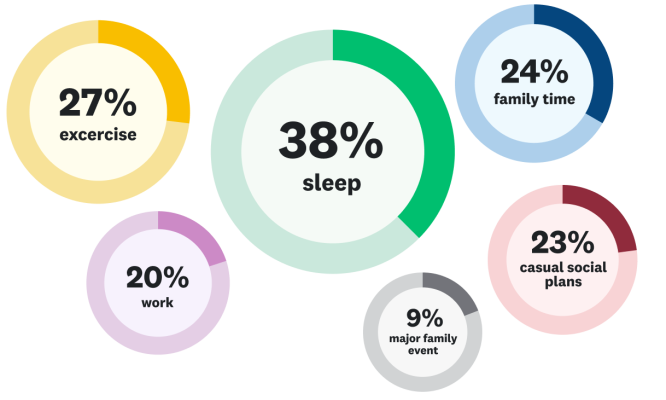
What have people been willing to skip to catch their favorite team play?

Focus on fans
80%
of people follow at least one sport
52%
of fans root for the same team their parents did
41%
of fans have switched loyalties and adopted a new favorite team
44%
of fans have a superstition that they keep, like wearing a lucky hat
These statistics are from a survey of 457 people from across the United States on SurveyMonkey Audience on January 27, 2023.
Be a fan of the feedback
Hosting a party? Be the host with the most with these planning resources.


Planning a bigger event?
If you’re doing a corporate viewing party or other larger event, get everything you need to know about gathering feedback pre- and post- event with this free guide.
Meet our fans
Learn how the Golden State Warriors use fan feedback to create an incredible experience.
“The world is constantly changing. All we know is that tomorrow's not going to be the same as today, so if you're not continuously adapting, continuously improving, it's hard to stay competitive.”
Charles Gao, Senior Manager of Business Strategy and Analytics of the Golden State Warriors
Discover more resources

Solutions for your role
SurveyMonkey can help you do your job better. Discover how to make a bigger impact with winning strategies, products, experiences, and more.

Trend forecast: What's shaping brands, AI and workplaces
Learn the top 5 trends driving business in 2026

Travel survey questions: 40+ examples to improve guest and traveler feedback
Use these 40+ travel survey questions and templates to collect feedback, boost guest satisfaction, and improve every traveller’s experience.

When you need to ask follow-up questions
Follow-up questions are a great tool to gather more insightful, specific data from surveys. Here's how and when you need to ask follow up questions.