Workplace trends for a new era
Uncover exclusive findings about the employee experience - from work-life balance to employee confessions and remote vs. in-office trade-offs - plus how data empowers today’s workers.

Wellbeing in the workplace
New research shows that employees are committed to their jobs, but the lines between work and personal time are increasingly blurred - and that cuts both ways.
True confessions from employees
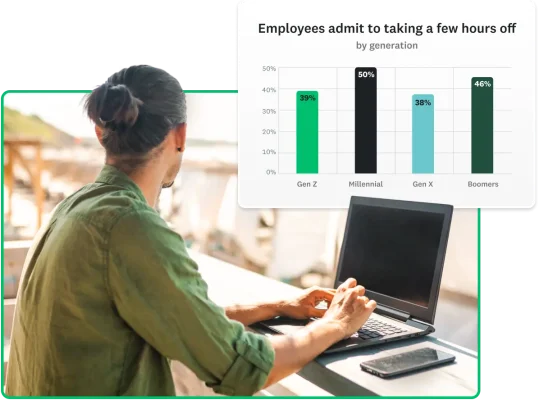
A quarter of Gen Z and Millennial workers have taken a “quiet holiday” in the last 12 months, compared with 13% of Gen X workers. On average, 43% of all employees, led by younger generations, take unreported time off during the workday.
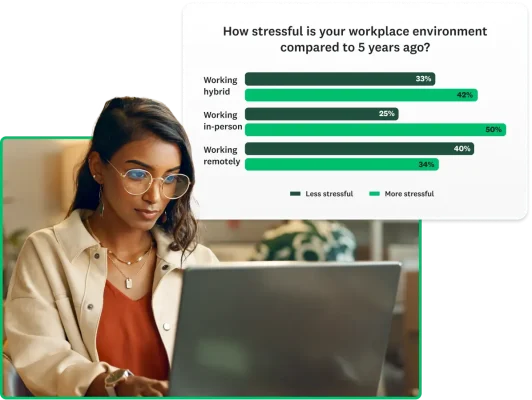
Less stressed working from home; more productive in office
In-person workers report feeling more stress than remote or hybrid workers, however 48% of all workers say they are more productive when working in office.
Working hard and playing less?
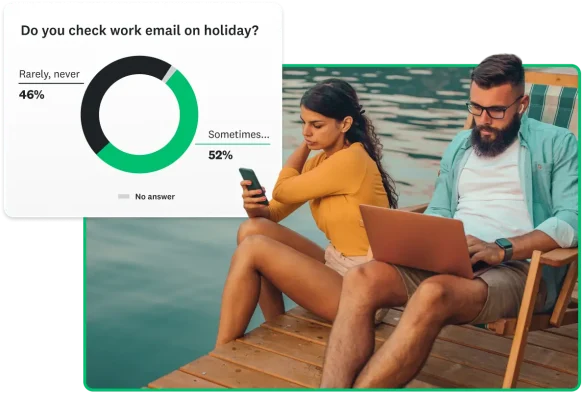
Managing the boundaries between work and personal life is a struggle: over a quarter of workers (27%) are asked to work while on holiday and more than a third have difficulty disconnecting from work while on holiday.
Ready to uncover your own insights?
Ask the questions you’re curious about and discover what matters most.
Show me the data
Our research uncovers that data has a big impact on all aspects of work, from good decision making to proposing an idea with confidence and having trust in teammates and leaders.

Data carries more weight than job titles
When making important decisions, 70% of employees would trust a person with data more than someone with a higher job title. That number jumps to 78% for C-level executives.
Confident workers bring data to the table
Almost eight in 10 workers (77%) are very comfortable making decisions when they have data to back it up, however, 36% say the leaders at their company make decisions primarily based on intuition.

Data issues can drive poor decisions
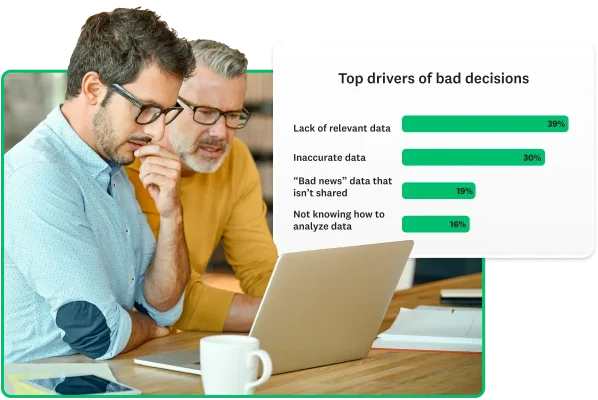
Two-thirds (65%) of workers have made a poor decision at work due to some issue with data, which is higher for C-level executives than for individual contributors.
Get insights on what’s important at your organisation
“Today’s workplace is diverse and dynamic, shaped by age, identity, education, workspaces, and ever-evolving ways of working. Our goal is to illuminate the true nature of modern work, break through outdated myths and generalisations to deepen our collective understanding of the employee experience.”
Wendy Smith, Senior Manager, Research Science, SurveyMonkey
Explore more workplace insights, inspiration, and best practices from SurveyMonkey

Remote employee experience (REX): basics and best practices
Explore the basics of remote employee experience, why it's important, and our best practices for improving remote employee satisfaction using employee feedback.

Curiosity Week at SurveyMonkey
Explore how this company-wide program expands our teams’ thinking, sparks curiosity and foster continuous growth and innovation.

The ultimate guide to collecting employee feedback
Get insights, examples, tools and resources to help you build an effective employee feedback strategy.
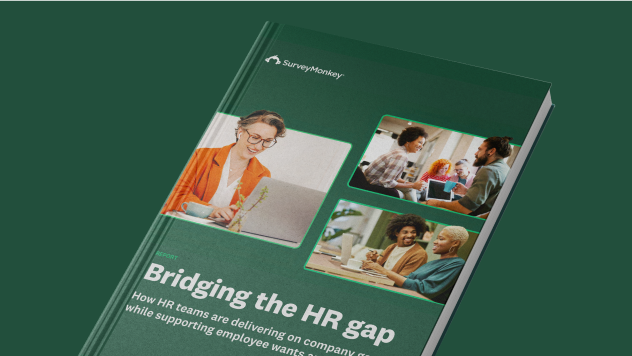
Uncovering the HR gap
New research on how feedback can bridge the gap between HR priorities and what employees say they need.
Get insights to power your projects
Methodology
SurveyMonkey “Workplace trends” study was conducted on 5-14 August, 2024 among a sample of 3,397 full time workers in the UK
SurveyMonkey “Data at work” poll was conducted on 19-30 July, 2024 among a national sample of 3,003 full time workers in the UK
For both studies, respondents were selected from a non-probability online panel. The modelled error estimate for these surveys is plus or minus 1.0 percentage point. Data were weighted for age, sex, education and region using data from the UK Office for National Statistics.