The average person spends 135 minutes on social media every day. It’s where we get our news, our entertainment, and—at this point—a sizable chunk of our human interaction. But where exactly are those 135 minutes spent—Facebook? Twitter? YouTube? And who is spending their time there?
Using SurveyMonkey Audience, we partnered with Hubspot to ask 2,764 people across three different continents (Europe, North America, and South America) how they felt about each of the major social networks: which platforms they like, which they distrust, and whether their browsing habits influence their buying habits.
If you’re a marketer or creator deciding where to focus your content efforts, the first step to success is finding the platforms with the most receptive audiences.The second step is earning their trust.
Read Hubspot’s sister report on how content informs buying behavior.
The most popular social media platform—and the least
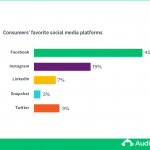
When it comes to preference, Snapchat was the clear loser and Facebook was the clear winner across demographics. People's opinions of Facebook varied wildly—it was simultaneously the most liked and disliked platform and it was the one most people said they could quit—and also the one most said they couldn't live without. But with 2 billion users, these kinds of differences aren't surprising—but Snapchat’s poor performance across the board spells bad news for the picture messaging platform.
As mentioned before, Facebook is the most divisive social network—respondents either loved it (47% listed it as a favorite) or hated it (22% listed it as least favorite), with very few falling in between. But regardless of people’s reservations (and a flurry of bad press) Facebook’s international dominance is unquestionable. The top 2 favorite networks in every region were Facebook and Instagram (which is also owned by Facebook.)
Meanwhile, Snapchat was the least popular “favorite” platform (4%—even professional network LinkedIn was more popular at 7%) and 16% of the population’s least favorite platform. It was also the platform that respondents were most likely to have quit (20%).
Want to do your own global research?
SurveyMonkey Audience gives you access to consumers all over the world, so you can get answers in minutes.
Social media in the U.S., Europe, and Latin America
Our survey included respondents from the U.S., U.K., Germany, Mexico, Colombia, and Spain, which we broke down into the broader categories of U.S., Europe, and Latin America.
In general, social media trends seemed to match across regions—a possible testament to the globalizing effect of the internet. The platforms people like and trusted were generally the same across all regions we surveyed.
Although the distributions were similar, there were some differences in how much trust respondents from each place felt. Latin Americans were more likely to trust content from every social media platform we asked about, while Europeans and U.S. respondents were more skeptical.
However, European media’s emphasis on digital privacy around GDPR, additional regulations, and antitrust suits against internet companies like Google doesn’t seem to have sowed deeper distrust of social networks. Trust levels for different platforms followed similar distribution patterns in the U.S. and Europe, and were mostly positive. Americans were also the most pessimistic about social media’s impact on society and most likely to report plans to quit most forms of social networking.
That said, the country with the least trust in social media was Germany, while Colombians consistently listed the most positive feelings. Latin Americans were also most likely to put Facebook as their favorite form of social media (57% vs. 40% in Europe and 47% in the U.S.)
| Related content: How to do your own market research: the ultimate guide |
Millennials vs. baby boomers: who quits social media?
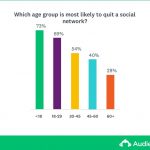
You might have suspected that the generation that grew up in the digital age would be have less natural distrust of technology—and you’d be right. Millennials and Gen Z respondents were much more likely than baby boomers to trust every form of social media—but they were also significantly more likely to quit. Trust might be higher for younger generations, but patience is not.
Sixty-nine percent of millennials have quit a social network, compared with 28% of respondents over 60. One obvious complication is that you can’t quit something that you’ve never used, and older generations are less likely to have created a social media account in the first place. That said, it seems like the accounts they do have are likely to stay up.
The sites that millennials were most likely to have quit were Snapchat (30%) and Twitter (26%). Among boomers who’d quit, Twitter was the most common exodus (15%).
Young people seem especially open to visual content. Instagram and YouTube are clear favorites, and according to Hubspot’s analysis, consumers 18 to 29 are almost 8 times more likely to discover a product on Instagram than someone older.
Social media is here to stay
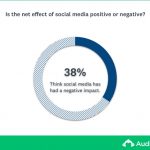
In spite of bad press, most people are optimistic about the impact of social media. 52% of people think that social media has a very or somewhat positive influence on society and only 38% think that the impact is negative (10% answered that there was no impact).
No more than 20% of respondents were willing to quit any given platform, and 34% had never even considered leaving social media (of any form). Though the individual platforms might fall in and out of favor, the public seems to consider social media a vital piece of modern life and communication.
The top reasons consumers would quit a platform? If it stopped being useful to them (47%), showed too many ads (30%), or had “objectionable content” (26%). Still, that could be interpreted to mean that up to 53% of people would continue to use a social network even if it wasn’t useful to them anymore.
Social media content plays a major role in determining public beliefs—including buying habits. In fact, per the Hubspot report, over 50% of people under 45 use some form of social media to discover new products.
Which social networks do people trust most?
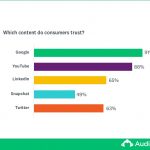
With “fake news” in the real news (headlines) for the past few years, how willing are consumers to let their guard down on social media? According to our research, it depends on the platform.
Google is unquestionably the most trusted place to access new content, with 91% of users saying that they either always or sometimes trust what they find there. YouTube, interestingly, was a close second, with 88% saying the same. That might not be surprising in and of itself, but it beat out LinkedIn (65%) and Twitter (63%) by a significant margin.
Either people are more willing to trust content that they’ve personally searched for, or they believe that video content holds more water than written words (which would be consistent with Hubspot’s research about content mediums last year—and our recent discovery that YouTube is the #1 app that people “can’t live without.”)
The popularity of video doesn’t extend to the short, ephemeral kinds though—at least, not Snapchat. Only 49% of respondents trusted even some of the content on Snapchat—the only option to dip below 50%.
How to create social media content that earns consumer trust
So how do you create content that catches attention in the madness of a newsfeed and earns the consideration it deserves? Besides choosing your platform(s) carefully, you can also tailor your work to overcome the weaknesses of the social media you’re working with and support the preferences of the average browser.
Tip 1: Tell your story with numbers. In previous research we found that 73% of people find articles that rely on data to be more persuasive than other types of writing and 74% think data stories are more trustworthy.
If you’re marketing, or just trying to dazzle a scrolling reader, it’s tempting to lean on emotional appeals and dramatic language (“This piece of original content will SHOCK you!!!)—but if your goal is to win the reader’s trust, that’s not going to help you.
Young people are especially discerning when it comes to separating fact from opinion, according to Pew Research. If you’re targeting millennials, it’s better to lead with data.
Tip 2: Pictures speak louder than words. The prevalence of YouTube and Instagram across all demographics in our study mean that visual content is a rich area of opportunity. Images are also consistently proven to stand out more and be more engaging than other kinds of content.
Charts, infographics, and other data visualizations are a good way to communicate sophisticated ideas, instantly.
Tip 3: Use real human voices, not marketing language. Most social media is predicated on relationships and personal networks. Even on professional platforms like LinkedIn, social media users are usually more interested in personal interaction.
Thirty percent of people would quit using a social network because of ads, and only 8% of respondents considers marketers to be trustworthy. If the voice of a brand isn’t cutting it, maybe the voice of an individual will: According to our recent report on buyer trust, 82% of people trust the words of a customer over brand or product messaging.
The most powerful part of social media is its unique ability to facilitate something viral. If you get the tenor right, you end up with content (and products) that people want to share. Over half the people in our study talk about their favorite products at least once a week. On the right platform, that advocacy could be incredibly powerful.
To learn more about how social media influences buyer behavior, check out Hubspot’s sister report here.

