Sometimes the trickiest part of writing a survey isn’t coming up with your questions but figuring out what answer options to pair with them. When we help our users create new surveys, we often see response scales that are unclear or counterintuitive. Maybe they use a frequency scale (from always to never) when they should have just a simple yes or no response scale, or maybe they have a select-all-that-apply question that only allows for a single response.
Having a survey response scale that is correctly matched to a question may not seem like a big deal, but even small stumbling blocks can cause problems for respondents when they’re taking your survey.
In new academic research published in the Journal of Survey Statistics and Methodology*, researchers at the University of Nebraska-Lincoln quantify the degree to which these haphazard questionnaire mistakes cause annoyance or confusion for respondents and lead to poor data quality.
The experiment: Matched vs. mismatched survey response scales
To test whether mismatched questions and answers have any effect on a survey, the researchers created several surveys and divided the respondents in each into two groups: one that saw a version in which all question and answer options were correctly matched to each other, and the other in which the questions and answers were slightly mismatched.
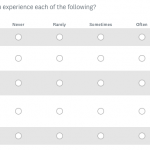
Here’s how that might look:

The respondents in group 1 saw a set of questions much like the one above. As you can probably tell, this survey question correctly matches the question with its answer scale. By starting with “How often…” the question stem clearly indicates that the intended response will fall on some frequency scale. As respondents are reading the question, their brains are already processing what the question is asking and how they should respond. They very likely have thought of what their response will be before they get to the answer options. Even if they’re thinking about a response that doesn’t appear as an answer category—maybe “all the time”—they can easily identify which category comes closest to their own response—i.e. “always”—, select it, and move on to the next question.

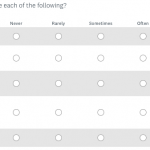
Respondents in the second group saw questions like the one above, which has a slight mismatch between the question and the answer options. The researchers expect some respondents in group 2 to be confused by these mismatched questions and answers: “Theoretically, mismatches should increase response difficulty. When answering survey questions, respondents must perceive a question, comprehend it, retrieve relevant information, formulate a judgment, and then report.”
As respondents are reading the mismatched question, they are likely mentally forming a simple yes or no response. Then, when they see that the survey response scales don’t include yes or no, they have to spend some time figuring out where their response maps onto the set of options provided. It quickly becomes a two-part question, in which respondents who had been thinking that yes, they feel safe where they live, now have to consider how often they feel safe where they live—is it all the time? Just sometimes? Rarely? If they felt unsafe on one occasion, how should they respond? This question is more complicated than they had originally thought.
This additional cognitive processing takes time. Respondents likely have to think for a few seconds about which category is true for them. They may even go back to read the question to make sure they understood it correctly.
The results: Mismatched response scales affect skip rates and response times
The researchers theorize that this “cognitive effort” will take a toll on the respondents, making those who see the mismatched questions more likely to skip those questions. The results from their experiments prove this to be true. Comparing responses from the two groups, the researchers found that the odds of a question being skipped in the mismatched version were 1.6 times those in the matched version.
In a similar experiment using mismatched questions and answers in a survey conducted via telephone interviews, the same researchers found an additional downside to mismatched questions and answers: people who were asked the mismatched questions took more time to complete the survey than people who were asked the questions that were correctly matched.
How to choose the correct survey response scale every time
So, it’s important to appropriately match your questions and answer scales. How do you make sure to do that when you’re making your next survey?
SurveyMonkey Answer Genius uses machine learning technology to assist you as you’re creating your survey in real time. As you type your question, Answer Genius automatically populates the answer fields with a suggested answer scale.
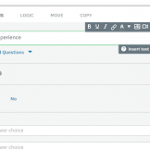
For example, here’s the suggested answer scale that pops up when you start to type in the “Do you experience each of the following?” question the researchers used in their study. You can see that Answer Genius recognizes this should be a yes/no answer scale—just like we want.

When you start to type in the alternative version of the question, “How often do you experience each of the following?” that yes/no answer scale disappears. You can click on the Answer Genius dropdown to select the Always/Never scale that would be appropriate here.

Even with SurveyMonkey Genius, it’s still possible to make a little mistake that can have a negative impact on your survey. It’s a good idea to have a friend or colleague read and test your survey for you before you send it out. Getting a second opinion on question wording and having them check for spelling or grammatical errors can end up saving you (and your respondents) some stress before it’s too late.
* Jolene D Smyth, Kristen Olson, The Effects of Mismatches between Survey Question Stems and Response Options on Data Quality and Responses, Journal of Survey Statistics and Methodology, Volume 7, Issue 1, March 2019, Pages 34–65, https://doi.org/10.1093/jssam/smy005


