P-value calculator: How to calculate p-value
Is your data sufficient to reject the null hypothesis? Calculate p-value with our calculator.

P-value calculator
Z-Score
Test Type
Significance Level
The p-value is
0
The result is not significant at p ≥
0.05
Picture this: you’re diving deep into the world of analytics and statistics, trying to make sense of all those numbers and data points. Suddenly you stumble upon a little gem called the p-value. It’s like a secret code that researchers use to unlock the mysteries of hypothesis testing and significance.
The primary use of the p-value is for decision-making in hypothesis testing. It helps researchers assess whether the observed data is enough to reject the null hypothesis in favour of an alternative hypothesis. Researchers also use the p-value to compare groups or to test for correlations.
Gather answers using the SurveyMonkey p-value calculator above.
What is a p-value?
The p-value stands for probability value. It measures the likelihood of a result, assuming the null hypothesis is true. It’s a probability gauge showing how likely your result is, assuming no real difference (the null hypothesis).
The p-value quantifies the strength of evidence against the null hypothesis. It is typically compared to a predetermined level of significance, such as 0.05. When the p-value is low, it tells you that this result probably didn’t happen by chance. This gives you the green light to reject the null hypothesis and consider that your hypothesis might be true.
The p-value is important because researchers use it to decide whether to accept or reject the null hypothesis. Some examples of research questions that can use the p-value are:
- “Do men and women differ in terms of customer satisfaction?”
- “Is satisfaction with training programmes associated with employee satisfaction?”
A low p-value suggests that there are differences among the groups you tested. It also indicates that real, predictable relationships among variables may exist.
Researchers can then interpret the significance of their findings and communicate the strength of evidence to stakeholders and peers.
How to calculate p-value
To calculate a p-value, first determine the probability of obtaining your data if the null hypothesis were true. Then compare this probability to your chosen significance level (usually 0.05) to decide whether your results are statistically significant.
Calculate the p-value from the z-score
To calculate a p-value from a z-score, look up the z-score in a standard normal distribution table. Alternatively, use software to find the corresponding probability. This probability represents the likelihood of observing a value as extreme as the z-score under the null hypothesis.
The following formulas give the p-value:
- Left-tailed z-test: p-value = P(Zscore)
- Right-tailed z-test: p-value = 1 - P(Zscore)
- Two-tailed z-test: p-value = 2 × P(−|Zscore|) or 2 - 2 × P(|Zscore|)
Here’s a step-by-step guide to calculating the p-value from a z-score:
- Understand the problem: You have data and want to know how likely it is to obtain that result. You also want to see how likely something more extreme would be, assuming the null hypothesis is true.
- Find the z-score: Start by finding the z-score of your data. This tells you how many standard deviations away from the mean your data point is. Find your z-score by leveraging statistical software (such as R or SPSS) or look up the standard deviation in a table (like this one).
- Determine the direction: Choose a one-tailed test (extreme values in one direction) or a two-tailed test (in both directions). If you expect the difference to be significantly smaller or larger, use a one-tailed test (the left- or right-tailed test). If you don’t have a hypothesis about which direction the difference will be, use a two-tailed test.
- Look up the z-score: Using a standard normal table, software or a p-value calculator, find the cumulative probability.
- Calculate the p-value by leveraging the p-value calculator above, or:
- For a one-tailed test: If the z-score is positive (right-tailed test), subtract the cumulative probability from 1. If the z-score is negative (left-tailed test), use the cumulative probability directly.
- For a two-tailed test: Double the cumulative probability to account for both tails. Then subtract it from 1 if the z-score is positive.
- Interpret the p-value: If the p-value is very small (usually less than 0.05), this suggests it is unlikely that your data is under the null hypothesis, indicating statistical significance. You can also use our p-value calculator above to interpret the p-value based on the confidence level.
Calculate the p-value from the t-score
To calculate a p-value from a t-score, first, determine the t-score representing the difference between your sample mean and the population mean. Then use a t-distribution table or software to find the probability of observing that t-score. This indicates the likelihood of obtaining your sample results under the null hypothesis.
The following formula shows how to calculate the p-value from the t-score.
- Left-tailed t-test: p-value = cdft,d(tscore)
- Right-tailed t-test: p-value = 1 - cdft,d(tscore)
- Two-tailed t-test: p-value = 2 × cdft,d(−|tscore|) or p-value = 2 - 2 × cdft,d(|tscore|)
Where cdft,d represents the cumulative distribution function of the t-Student distribution with d degrees of freedom.
Here’s a step-by-step guide to calculating the p-value from a t-score:
- Understand the situation: You have sample data and want to know how likely it is to obtain your results. This assumes there is no actual difference in the population.
- Calculate the t-score: This measurement tells you how different your sample mean is from the population mean.
- Determine degrees of freedom: This is based on your sample size. It helps you look up the correct probability in the t-distribution table.
- Check the t-distribution table: Look up your calculated t-score in the table. This provides the probability of observing that difference or more if there is no actual difference in the population.
- Interpret the result: If the p-value is very small, it is unlikely that your sample results are under the null hypothesis. This suggests your results might be significant.
Calculate the p-value from the Pearson Correlation
To obtain the p-value for a Pearson correlation coefficient, first use the calculated coefficient to derive a t-statistic. Then you can find its associated p-value using the t-distribution with degrees of freedom (n - 2).
The following formula is used to calculate the t-statistic from a Pearson correlation coefficient:
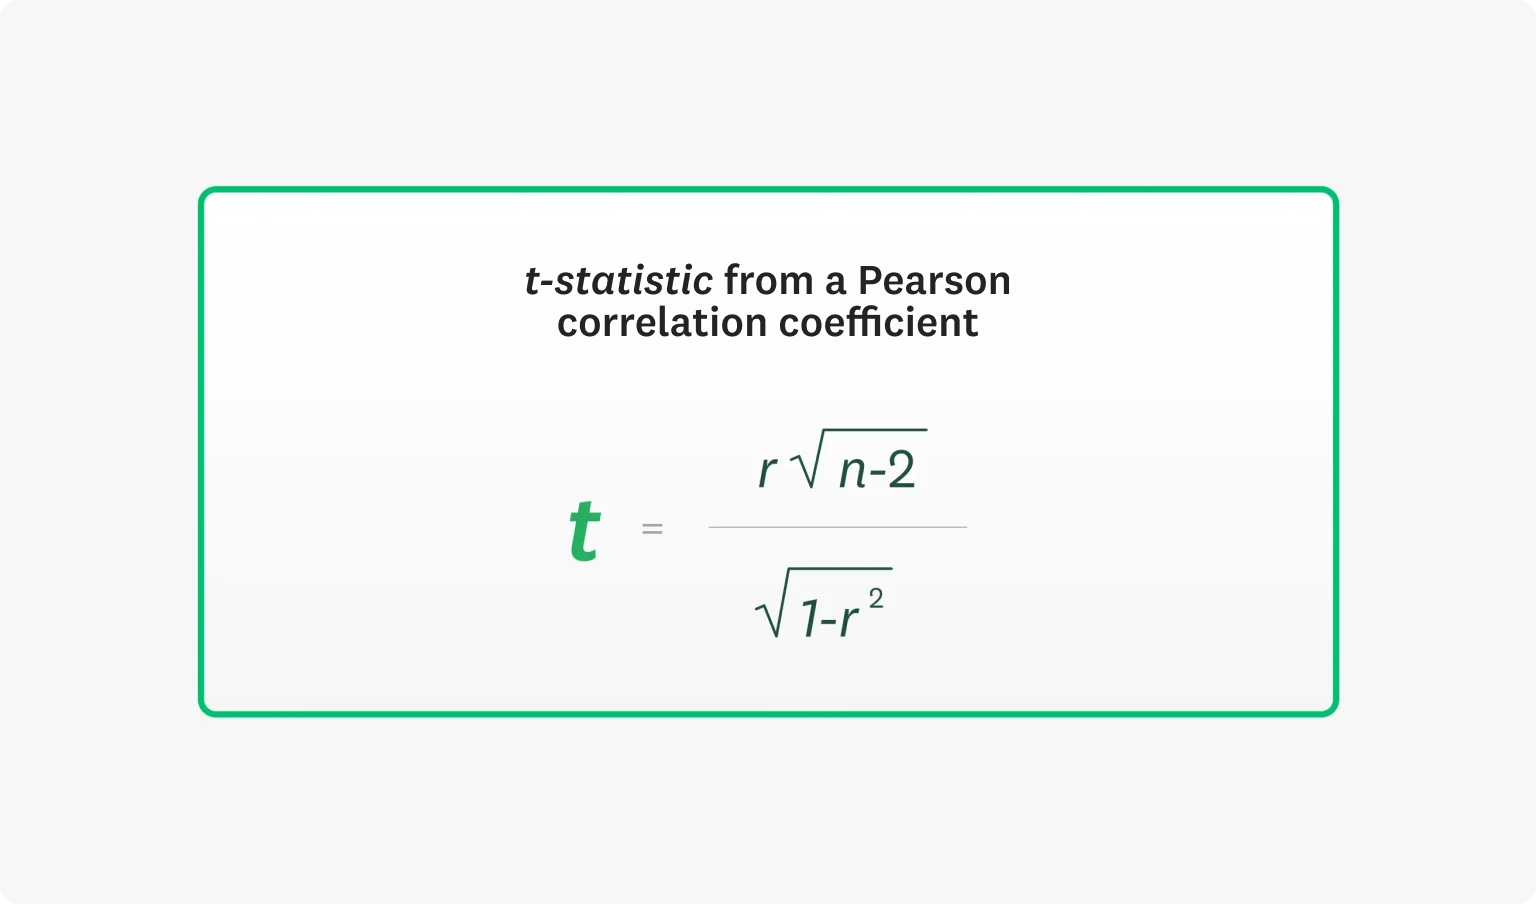
Where:
- r is the Pearson correlation coefficient.
- n is the sample size.
After obtaining the t-statistic, you can calculate the p-value using the cumulative distribution function of the t-distribution. This uses n - 2 degrees of freedom, where n is the sample size.
The general process is as follows:
- Understand the situation: You have some sample data and want to find out whether two variables are correlated.
- Calculate the t-statistic: Convert the correlation coefficient (r) to a t-statistic using the above formula.
- Determine the degrees of freedom: Calculate the degrees of freedom (df). Use the formula 𝑑𝑓 = n - 2, where n is the sample size.
- Find the p-value: Once you have the t-statistic and degrees of freedom, you can use a t-distribution table or a statistical software package to find the p-value associated with the calculated t-statistic.
- Interpret the result: If the p-value is less than your chosen significance level (commonly 0.05), you reject the null hypothesis and conclude that there is a statistically significant correlation between the two variables. Otherwise, you fail to reject the null hypothesis.
Calculate the p-value from the chi-square score
To calculate the p-value from a chi-square score, determine the degrees of freedom associated with the chi-square distribution. Then use statistical tables or software to find the probability of obtaining a chi-square value as extreme as the observed one.
You can get the p-value by using the following formula:
p-value=1− cdfχ² (x; df)
Where:
- x is the chi-square test statistic.
- cdfχ² is the cumulative distribution function of the chi-square distribution.
- df is the degrees of freedom.
You subtract the cumulative probability from 1 because the chi-square distribution is right-skewed, so the tail area to the right of the observed chi-square value corresponds to the p-value.
Here are step-by-step instructions for calculating the p-value from a chi-square score:
- Understand the situation: You have categorical data and want to see whether the variables have significant associations.
- Compute the chi-square score.
- Determine degrees of freedom (df): Degrees of freedom are determined by the number of categories minus 1 for a simple chi-square test. For a chi-square test of independence, it is calculated as (rows−1)×(columns−1).
- Find the p-value: Use statistical tables or software to find the cumulative probability for the chi-square and degrees of freedom. This is the area to the right of the chi-square value under the chi-square distribution curve.
- Interpret the result: Compare the obtained p-value with your chosen significance level (commonly 0.05). If the p-value is less than the significance level, you reject the null hypothesis and conclude that there’s a significant association between the variables. Otherwise, you fail to reject the null hypothesis.
How to interpret the p-value
If the p-value is less than or equal to 0.05 (or any chosen significance level), this suggests that the result is statistically significant, meaning that the observed result is significant at the α level.
This indicates that the probability of obtaining an extreme result – assuming the null hypothesis is true – is very low. Typically, this probability is less than 5%.
Therefore, you reject the null hypothesis in favour of the alternative hypothesis. This indicates some evidence to support the claim made by the alternative hypothesis.
If the p-value is greater than 0.05, this suggests that the observed result is not statistically significant at the chosen significance level. In other words, there is insufficient evidence to reject the null hypothesis. This means we cannot conclude that the observed result differs from what would be expected under the null hypothesis.
Related reading: How to analyse survey data
Common p-value mistakes
Using the p-value to represent real-world probabilities
Some people believe that a p-value of 0.05 means there is a 95% chance that the test hypothesis is true and a 5% chance that it is false. This is a misinterpretation of the p-value.
P-values indicate the likelihood of observing the data, assuming the null hypothesis is true. They are not direct measures of the probability of hypotheses being true or false.
Treating p-value as effect size or importance
Treating the p-value as synonymous with effect size or importance is a common misconception. This blurs the line between statistical significance and practical significance.
A small p-value indicates that it is unlikely that the observed result is due to random chance. However, it does not convey the effect’s magnitude. Additionally, it does not reflect the practical relevance of that effect.
For instance, even tiny deviations from the null hypothesis may yield statistically significant p-values in large datasets despite being practically insignificant. Also, if an experiment yields significant differences multiple times, it is likely that it will yield non-significant results sometimes because this is based on probability.
Conversely, a large p-value doesn’t necessarily imply that the observed effect is trivial. Instead, it suggests that the data do not provide convincing evidence against the null hypothesis.
To accurately assess the practical importance of findings, it is essential to complement p-values with measures of effect size. Effect size quantifies the magnitude of the observed effect. It helps researchers contextualise results within the broader scope of the research question or application.
This distinction ensures that statistical significance aligns with meaningful real-world implications. It guides informed decision-making and interpretation of research outcomes.
Failure to account for multiple testing
The multiple testing problem arises when researchers conduct numerous hypothesis tests on the same dataset without appropriately adjusting the significance level. This practice significantly inflates the likelihood of encountering false positives, which are also known as Type I errors. In these situations, the null hypothesis is incorrectly rejected.
Imagine a scenario where several independent tests are conducted simultaneously. Even if each test maintains a low significance level (e.g. α = 0.05), the cumulative probability of observing at least one significant result by chance alone increases. This occurs as the number of tests increases.
Researchers employ statistical correction techniques such as the Bonferroni correction to make it more difficult to reject the null hypothesis. These solutions will help maintain stringent control over the overall false positive rate. They ensure that the probability of false positives across all tests remains below the specified threshold.
P-value best practices
Interpret results in context
Consider the practical implications of your findings within the broader context of your research question or application. Avoid overinterpreting statistically significant results or dismissing non-significant results without careful consideration.
Let's suppose that you find a statistically significant improvement in test scores among students taught using a new method and you compare this improvement to those taught using the traditional method.
In this case, you should avoid overinterpreting the results and, instead, consider factors such as the size of the effect. Is the score improvement substantial enough to justify implementing the new teaching method on a large scale? Would this finding be replicated in other studies with similar conditions? Are there any other factors, such as cost, that need to be considered?
Conversely, non-significant results could be due to other factors, such as a small sample size or measurement error.
Therefore, it’s important to critically evaluate the study design, data quality and potential sources of bias before drawing conclusions.
Report all p-values
Regardless of their significance, all p-values for all variables in a study should be included. This provides a comprehensive picture of the analysis. It enables readers to assess the robustness of the findings.
By reporting all p-values, researchers convey the complete range of statistical analyses, including those with non-significant results. This transparency allows readers to evaluate the consistency and reliability of the findings across different variables and analyses. It also promotes integrity in research by presenting the data in its entirety, without bias or distortion.
Be sceptical about small p-values
Caution is required when interpreting small p-values. They can sometimes be misleading indicators of the significance of observed effects.
It’s crucial to recognise that small p-values may arise owing to genuine effects and large sample sizes. The use of large sample sizes increases the statistical power to detect trivial deviations from the null hypothesis.
Therefore, small p-values in studies with large sample sizes may not necessarily reflect meaningful or practically significant effects.
P-value FAQs
- What is a z-score?
- What is a t-score?
- What is a Pearson score?
- What is chi-square score?
Discover more resources

Solutions for your role
SurveyMonkey can help you do your job better. Discover how to make a bigger impact with winning strategies, products, experiences and more.

How to Analyse Survey Data in Excel
Learn how to analyse survey data in Excel and gain insights with our easy-to-follow guide.

Continuing healthcare checklist: what UK healthcare providers need
Learn what information healthcare and social workers need to provide for a continuing healthcare checklist, what happens next and possible outcomes.

Turning employee engagement statistics into actionable surveys
Discover how to use UK employee engagement statistics to design effective surveys. Use actionable insights to boost retention and drive productivity.