Research | State of Surveys 2025
How survey trends are changing with the rise of mobile
New proprietary data on the growth in mobile surveys and why it signals new habits, new users and better ways of collecting data.


This is our annual State of Surveys report. We looked at the 20 million questions answered on our platform every day and uncovered key survey-taking trends, including the experiences people expect, which question types work and the devices people want to use.
Keep reading to explore the latest survey trends and how you can create better surveys that deliver the best insights.
SURVEY TRENDS
–
The people have spoken
People want to take surveys on mobile devices.
A streamlined survey is more trustworthy and more likely to be answered.
Generational and cultural differences can affect the survey experience.
Mobile surveys dominate across the globe, even in the U.S.

Globally, mobile survey responses have outpaced non-mobile ones for the past five years. However, 2024 was a milestone year because our research uncovered that almost six out of ten surveys were taken via mobile devices.

WHY THIS MATTERS
The growth in terms of mobile survey responses means that every aspect of a survey should consider the end user experience. How will the survey look on their device of choice? How long will it take? Which question and answer formats work on a smartphone screen?
Key takeaways
• Meet users where they are with a mobile-first approach to surveys.
• Make sure your survey works on every device.

“We’re seeing trends that suggest a change in how people create and take surveys. While gathering information and data is as important as ever, the methods are becoming more streamlined to support a mobile experience.”
–
Wendy Smith
Senior Manager, Research Science, SurveyMonkey
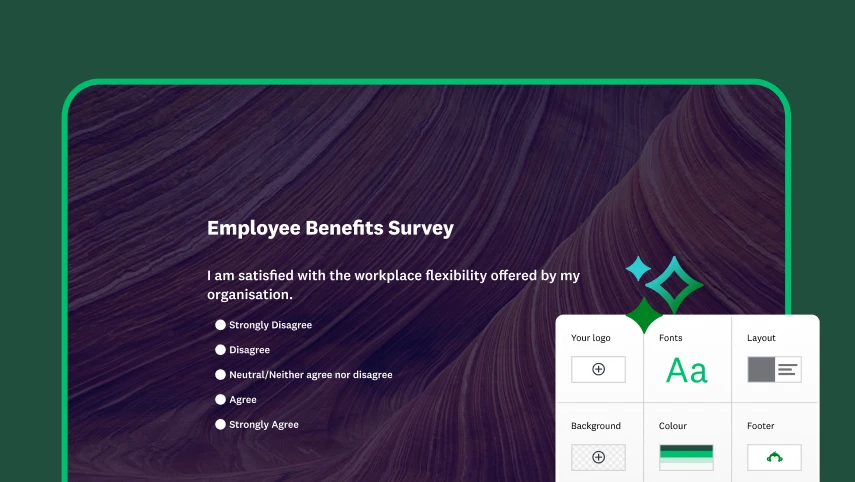
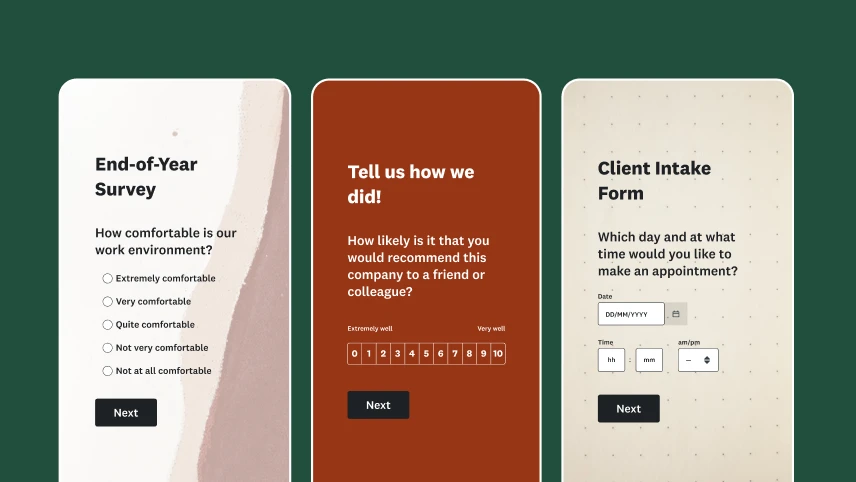
Survey trends by design: Simplified and tailored


Four in ten U.S. adults admit to being online all the time, and the figure is even higher for younger generations.
Sixty-two percent of people under 29 say they are online constantly and for 30-to-49-year-olds, the figure is 54%, compared to only 32% of people over the age of 50.
How are they accessing the internet? For nine out of ten adults, it’s a smartphone.
It just makes sense that surveys need to meet user expectations, especially for those people who are constantly online. People want a survey experience that’s streamlined, efficient and tailored to them.
We uncovered three trends that point to the trend towards more personalised, efficient, easy-to-take surveys.
❶
Only one in four surveys (23%) contained a matrix question in 2024, which is down from almost half (43%) in 2015.
WHY THIS MATTERS
Matrix questions are a great way to collect a lot of data in a single question with consistent answer options. For mobile surveys, consider reducing the number of answers in a matrix question or asking individual questions using a Likert rating scale.


❷
Almost 12% of surveys contained some form of skip logic in 2024, which is up from about 7% in 2019.
WHY THIS MATTERS
Surveys that use skip logic can deliver a better experience on mobile and on other devices by only showing respondents the most relevant questions for them, thus reducing the time they spend taking the survey.


❸
One in five surveys now contain at least one translation, meaning that multilingual surveys have more than doubled in the past decade.
WHY THIS MATTERS
Eight out of ten surveys in the U.S. that have more than one language include English, with Spanish, French, German, Japanese, Chinese and Korean also represented.
Accurate feedback starts with asking questions that are easy to understand. Adding a translation is an important way to ensure you’re collecting feedback that accurately represents how your audience feels.

Key takeaways
• Go for a streamlined survey that is a better experience for your customers or respondents.
• Use SurveyMonkey AI-powered features to evaluate your survey and make improvements to increase the average response rate.
• Consider offering a language experience tailored to your target audience.


"We love to offer all of our surveys in as many languages as possible so we can target each of our audiences and develop the survey specifically for them. What I really appreciate about SurveyMonkey is the ability to deliver default language translations, so the customer has the ability to change to a preferred language."
–
Christopher Hogan
Head of Finance, woom North America

Create better mobile surveys
See how our AI can build powerful surveys for you in just 60 seconds.
Reach all generations


Gen Z and Millennial workers are almost twice as likely as Gen X to find a survey trustworthy if it has a clean and modern design.
Gen Z and Millennial workers report taking surveys more frequently than Gen X, with 40% saying they take a survey on a monthly or weekly basis. Although they are excited to provide feedback, younger workers are also more likely to become bored when taking a survey.


Key takeaways
• Know your audience; a modern survey experience is more trustworthy to younger respondents.
• Make your survey engaging by creating more compelling questions using our Build with AI features or question bank.
Future of surveys: What our platform says about 2025
Discover what we learned from the 93 billion questions answered on our platform over the past two decades. In this article, Samuel Bakouch, senior vice president of product management at SurveyMonkey, shares how the data we gather about survey structure, question content and respondent behaviours inform our AI product strategy and how agile experimentation helps us create new features that our customers really want.

Samuel Bakouch
Senior Vice President, Product Management
SurveyMonkey
Explore more resources

Build better mobile surveys
Uncover the best practices for optimal mobile survey design.
Master the art of survey design
Read our guide to crafting questions from scratch, with AI or by using templates.
Create, manage and send surveys using mobile apps
Get expert-written, mobile-friendly templates for iOS and Android, or start from scratch.
Explore our all-in-one platform for surveys, forms and market research
METHODOLOGY
Rise in mobile: The data about device usage was collected between November 2020 to September 2024, with tablet/other device usage included but not shown. Device usage is calculated by dividing the number of survey responses taken on a specific device by the total number of responses submitted on the SurveyMonkey platform.
Matrix question usage: The data about matrix questions was collected between January 2024 and September 2024. The percentages are calculated by dividing the number of surveys with matrix questions by the total number of surveys fielded on the SurveyMonkey platform.
Skip logic usage: The data about skip logic was collected between January 2024 and September 2024. The percentages are calculated by dividing the number of surveys with skip logic by the total number of surveys fielded on the SurveyMonkey platform.
Multilingual surveys: The data about multilingual surveys was collected between January 2024 and September 2024. The percentages are calculated by dividing the number of multilingual surveys with the specified language translation with more than one language by the total number of multilingual surveys deployed between January and September 2024.
Generational study: This SurveyMonkey study was conducted between 11 and 20 November 2024 among a sample of 6,774 workers in the U.S. aged 18+. Respondents for this survey were selected from a non-probability online panel. The modelled error estimate for this survey is plus or minus 1.5 percentage points.