How survey sample size works
Learn how to choose the right number of responses to make your survey results meaningful and statistically reliable.

Survey sample size is the number of completed responses you need for your findings to reliably represent your population. In research, the definition of sample size also reflects how much precision you can expect from your estimates, since factors such as sample size vs. population, margin of error and confidence level all shape statistical significance.
A clear sample size enables you to gauge how confidently you can interpret patterns in your data and whether your results apply to the wider group you want to study.
In this guide, you’ll learn how sample size works, how to determine survey sample size and how to calculate it – whether you’re collecting quick feedback or conducting formal survey research.
What is a survey sample size?
Survey sample size is the number of completed responses you need for your findings to reliably represent your population. Sample size reflects both the scope of your target population and the level of precision you want from your estimates. A right-sized sample helps ensure your findings are statistically reliable and not due to random variation.
Your ideal sample size depends on factors such as the population size, the margin of error and the confidence level. Most teams use a few standard settings and confirm the number of completed responses they’ll need with a sample size calculator. Clear inputs and a consistent approach set the foundation for reliable survey research across audiences and use cases.
Sample size vs. response rate vs. completion rate
Before calculating your sample size, it’s useful to understand how it relates to response rate and completion rate.
- Sample size is the number of completed responses you need for your findings to reliably represent your population.
- Response rate is the percentage of people you invite who submit a complete response.
- Completion rate is the percentage of people who start your survey and finish it.
For example, you might send your survey to a sample size of 1,000 people. If 400 people open your survey, your response rate is 40%. In most cases, not everyone who opens your survey will complete it. If 400 people open your survey but only 200 submit responses, your completion rate is 50%.
While response and completion rates do not set your sample size directly, they influence how many people you need to invite to reach your desired number of completed responses. Accounting for these rates helps ensure your final sample is representative and supports the reliability and statistical significance of your results.
How to determine sample size for survey research
Your survey sample size is determined by three inputs: the size of the population you want to represent, the margin of error you can tolerate and the confidence level you need. These settings work together to show the sample size required to detect statistically significant differences. The clearer your inputs, the easier it is to confirm the required number of completions in a sample size calculator.
Population (N): the group your results represent
Population is the full group you want your results to reflect. Required sample sizes level off for large populations; after roughly 100,000 people, you typically need about the same number of completed responses, no matter how big the audience gets. When your planned sample is a sizable share of the population (about 5% or more), you may apply the finite population correction (FPC) to slightly reduce the required number of completed responses.
Margin of error: how precise your estimates need to be
Margin of error determines how precise your estimates need to be. Teams often start with ±5%, while decisions with higher stakes usually require a tighter margin, such as ±3%, to reduce variability. Smaller margins of error require larger sample sizes, as they leave less room for uncertainty in your results.
Confidence level: how certain you want results to be
Confidence level shows how often you'd expect similar results if you repeated the survey with another sample. 95% confidence is a strong default, 90% confidence requires fewer completed responses when speed matters and 99% confidence increases certainty but typically needs a larger sample. These inputs work together to determine a statistically significant survey sample size.
How to calculate survey sample size
The quickest way to calculate survey sample size is by using a sample size calculator. After entering your population, margin of error and confidence level, the calculator shows how many completed responses you’ll need for a statistically reliable result.
If you’d like to see the maths behind the calculation, here’s the standard sample size calculation formula for estimating a proportion:
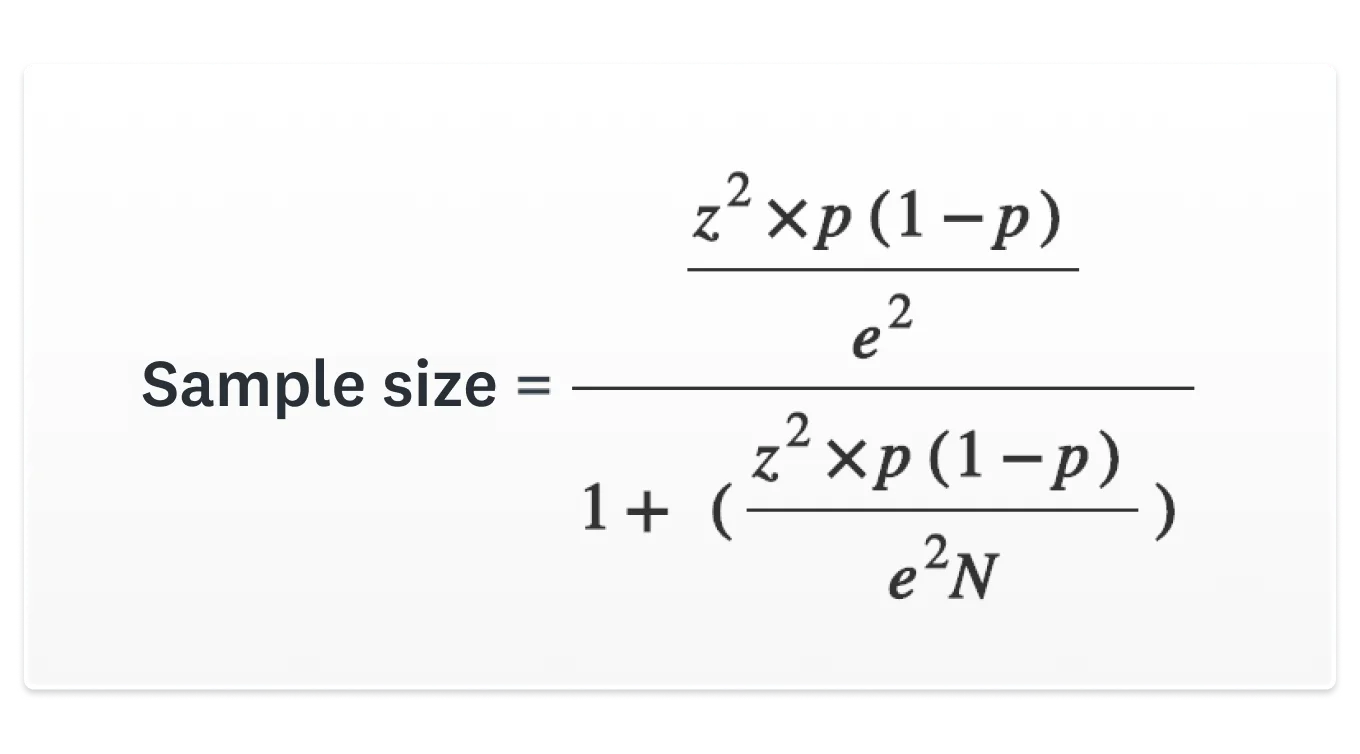
- n = required sample size (completed responses)
- z = z-score for your selected confidence level (for 95% confidence, z = 1.96)
- p = expected proportion selecting a particular answer (use 0.5 if unsure)
- E = margin of error in decimal form (e.g. 5% = 0.05)
Example:
If your population is 10,000,000 and you select 95% confidence (z = 1.96), a ±5% margin of error (E = 0.05) and p = 0.5, the formula gives:
n≈384.16n approx 384.16n≈384.16
Rounded up, you need 385 completed responses to estimate results for a 10-million-person population with those settings. You can confirm this figure or experiment with different scenarios in the sample size calculator, then adjust your inputs according to the level of precision you require in your estimates.
Once you’ve determined your target sample size, you’ll need a method for randomly selecting participants. A simple way is to generate a random sample in Excel to choose survey recipients without introducing selection bias.
How many survey responses do you need?
Want a quick estimate of how many people need to take your survey? Here’s a handy table to help you decide. All you need is the number of people in your target population and your desired margin of error (3–10%). These minimum survey completions assume a 95% confidence level and a 50% response distribution (p = 0.5) unless stated otherwise.
| Population | ±3% | ±5% | ±10% |
| 500 | 345 | 220 | 80 |
| 1,000 | 525 | 285 | 90 |
| 3,000 | 810 | 350 | 100 |
| 5,000 | 910 | 370 | 100 |
| 10,000 | 1,000 | 385 | 100 |
| 100,000 | 1,100 | 400 | 100 |
| 1,000,000 | 1,100 | 400 | 100 |
| 10,000,000 | 1,100 | 400 | 100 |
*Percentages represent a 3%, 5% and 10% margin of error
For example, if you’re conducting medical research, you might stick to a lower margin of error, such as 3%. But if you’re trying to determine a sample size for a customer satisfaction survey, you might be more comfortable with a higher margin of error, such as 10%.
What is a good sample size for survey research?
A good sample size depends on how precise your results need to be, how diverse your population is and how much risk is involved in the decision you’re making. Larger samples support tighter margins of error, higher confidence and stronger subgroup analysis, but bigger isn’t always better. In some surveys, rich qualitative feedback or overall participation matters more than hitting a specific sample size target.
How much does sample size actually matter?
Below are the scenarios where a larger sample truly makes a difference – and where it doesn’t.
High-stakes or regulated decisions
When accuracy is vital, such as in medical studies, policy research or safety-related changes, you’ll usually require a larger sample with a tighter margin of error (often ±3%) and at least a 95% confidence level.
These settings reduce variability and help ensure your estimates reflect the full population. Probability sampling is ideal here, since each person has a known chance of being selected and results support more rigorous inference.
Market research, pricing studies and diverse populations
For decisions like new market entry, pricing work or brand research, a moderate-to-large sample size lets you segment results by region, demographic groups or customer type.
As population diversity increases, for example with differences in age, location, income or other traits, you’ll typically need more completed responses to ensure each subgroup is represented. A margin of error of around ±3–5% usually supports this level of analysis.
Quick feedback, small groups or event and UX studies
When your audience is small and well-defined (such as 20–100 event attendees or usability testers), you don’t need a large sample to find out what matters. Written feedback, open-ended responses, and engagement patterns often provide more value than achieving a specific sample size.
A full census of the group or a pragmatic non-probability approach is usually sufficient, as long as you stay mindful of potential biases.
Why sample size has diminishing returns
Across all of these scenarios, remember that sample size has diminishing returns. Once your population reaches a certain scale, required sample sizes level off, and you usually only adjust with a finite population correction when your achieved sample is a sizable share of the total.
Choose a sampling design: Probability vs non-probability
Sampling design determines how you select people for your survey, and it shapes whether you end up with a representative sample and reliable results. A strong design helps reduce sampling bias and ensures your sample reflects the population you want to understand.
Sampling methods fit into two groups: probability sampling and non-probability sampling, each with a set of common techniques.
Probability sampling
Probability sampling gives every person in your target population a known chance of being selected. This approach is the foundation for producing a representative sample, supporting stronger inferences and reducing sampling bias.
There are four commonly used probability sampling methods, each suited to different research needs.
1. Simple random sampling
In simple random sampling, every member of your population has an equal chance of being chosen, often via a lottery or random number generator. This method minimises bias as the selection is entirely random, but it does require a complete and accurate list of the entire population, which can be challenging to obtain for large or decentralised groups.
2. Systematic sampling
Systematic sampling involves selecting people at regular intervals, such as every 50th name on a list. It’s quick, efficient and easy to implement, especially when dealing with ordered data. However, if the list contains underlying patterns that match the interval (for instance, if every 50th entry shares a similar characteristic), this can unintentionally introduce bias.
3. Stratified sampling
Stratified sampling divides your population into meaningful subgroups, such as age ranges, regions or customer types, and then randomly samples within each group. This method is especially valuable when ensuring subgroup representation is important, as it guarantees your sample reflects the diversity of your audience. The trade-off is that it requires accurate information about your strata in advance and takes more planning to carry out.
4. Cluster sampling
Cluster sampling involves grouping your population into clusters, such as neighbourhoods, schools or store locations. You then randomly select a set of clusters and survey everyone within them. This method is practical and cost-effective for large, geographically dispersed populations, but it can increase sampling error if the clusters differ significantly.
Non-probability sampling
Non-probability sampling is used when people in your population do not have an equal or known chance of being selected. These approaches are often quicker, more flexible and less costly than probability methods, but they carry a greater risk of sampling bias. As the selection isn’t random, the results may not represent the full population as reliably.
Here are five common non-probability sampling methods and when they’re typically used.
1. Convenience sampling
Convenience sampling collects responses from the people who are easiest to reach, such as customers already on your email list or visitors to your website. It’s quick and cost-effective, making it useful for exploratory work or early feedback. However, because participants self-select based on accessibility, their views may not reflect the broader population.
2. Purposive or judgemental sampling
Purposive sampling selects individuals because they have specific characteristics or expertise relevant to your research. This method is commonly used in qualitative studies where you want depth over breadth, for example, interviewing product experts or longtime customers. The trade-off is that researcher judgement influences who is included, which can introduce bias.
3. Voluntary response sampling
Voluntary response sampling relies on people choosing to take your survey on their own, such as opting in from a link on a website or social post. It’s simple to deploy and can generate responses quickly. At the same time, it often overrepresents people who are highly motivated, either very satisfied or dissatisfied, which can skew results.
4. Snowball sampling
Snowball sampling begins with a small group of participants who then recruit others from their networks. This method is helpful when you’re studying niche or hard-to-reach populations, because it expands your reach organically. The limitation is that social networks tend to include people with similar traits, which can narrow the range of perspectives in your sample.
5. Quota sampling
Quota sampling divides your population into categories, such as age, gender or location, and then fills a preset number of responses in each category. This can help you quickly achieve demographic balance. However, because participants within each quota aren’t selected randomly, results may still be influenced by selection bias.
Frequently asked questions about survey sample size
- Is sample size the number invited or the number who answered?
- Do I always need 1,000+?
- Which is better: 90% or 95% confidence?
- Do I have to set p?
Pick your path: Calculate sample size, recruit respondents or refine design
Need help choosing your sample size? From expert sampling design to reaching your target market, pick the path that fits your next step.
- Need respondents? Reach targeted participants quickly with SurveyMonkey Audience.
- Just calculating? Use the SurveyMonkey sample size calculator and double-check using the margin of error calculator.
Set your sample size, then field your survey
You don’t need advanced statistics to set the right sample size. A few clear inputs and a quick check are all it takes. Start with common defaults like 95% confidence and a ±5% margin of error, then tighten or relax those settings based on how precise your results need to be. Once you’ve set your population, confidence level and margin of error, use the sample size calculator to confirm the minimum number of completed responses your study requires.
When you’re ready to field your survey, you can get started for free and build it quickly. If your study requires verified respondents or specific demographic profiles, SurveyMonkey Audience can help you reach targeted participants, with built-in quality controls to support reliable results.