AI SURVEY ANALYSIS
Instantly turn responses into insights with AI survey analysis
Our AI Analysis Suite helps you quickly spot themes, understand sentiment and filter out low-quality responses so that you can make sense of feedback faster and at scale.
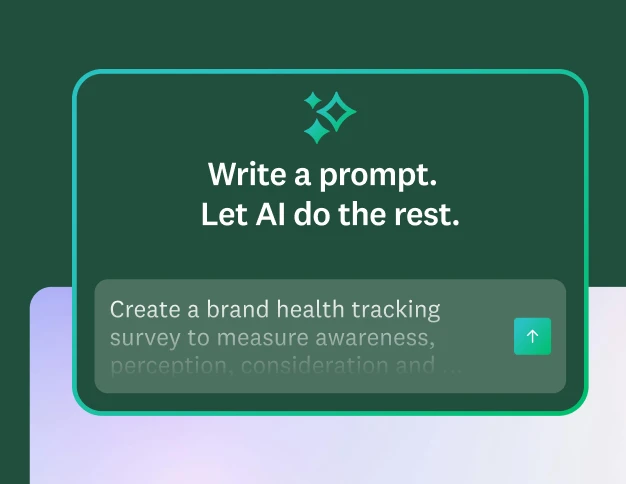
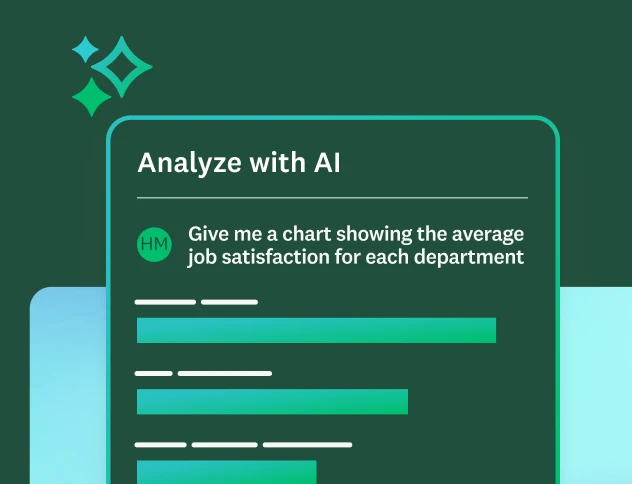
Analyse your surveys using AI and get insights at the click of a button
Simply type a question about your survey results and instantly obtain easy-to-understand insights, charts and summaries.


See the bigger picture in open-text feedback with thematic analysis
Stop drowning in open-text responses. Thematic analysis automatically categorises responses into meaningful themes, using AI to give you a clear view of what people are really saying without having to spend hours doing it manually.
Sentiment analysis at scale
Assess how respondents feel, not just what they say. Sentiment Analysis classifies open-text responses as positive, negative or neutral, helping you to read the mood across thousands of comments with ease.


Filter out low-quality responses
AI automatically flags low-quality or duplicate responses so that you can filter out noise and focus on reliable insights.

Gain smarter insights for market research
For researchers, SurveyMonkey’s AI-powered solutions go deeper, revealing the drivers of behaviour and the hidden trends that power smarter decision-making.
Explore all of our AI features
Learn how quick and easy it is to create and analyse surveys
using SurveyMonkey AI.
Put our AI Analysis Suite to work for your team

Discover what resonates with your audience
AI survey analysis helps marketers test campaigns and messaging, quickly revealing the themes and emotions behind customer reactions.


Discover our platform capabilities
Create better surveys with AI
Create polished surveys using AI and get customised tips to improve your survey response rate.
Analyse survey data
Learn best practices and see FAQs about data analysis on the SurveyMonkey platform.

Discover our top features
Explore SurveyMonkey features that help you get insights fast.

Our AI principles
Explore the transparency and accountability that guide how we build AI.
Surveys in seconds. Insights in minutes.
Start building better surveys with SurveyMonkey AI today; it’s free to try, simple to use and powerful enough to transform feedback into action.