How to use product development surveys for customer satisfaction
Gather valuable consumer feedback with surveys during the product development process to go to market with confidence.

- A product development survey gathers consumer feedback to guide the creation or improvement of a product or service.
- Surveys for product development are used to test concepts, refine features and validate ideas to ensure market alignment and customer satisfaction.
- Surveys provide valuable insights into consumer preferences, helping you to refine products and increase market success.
Sixty-one percent of product marketers believe that strengthening customer relationships is their company’s top priority. Product development surveys are valuable for gathering customer feedback, enhancing product design and improving customer satisfaction.
In this guide, we will share with you how to collect product feedback and use it to develop crowd-pleasing products.
What are surveys for product development?
A product development survey, also known as a product management survey, is a research tool that is used to gather consumer feedback about a product or service in development.
Product development surveys are valuable for identifying enhancements to existing products or gauging consumer reactions to new product concepts. Feedback from product development surveys can shape product design, speed up development and improve the final product.
How can surveys help with product development?

Product managers, marketers and researchers can use surveys to reach various audiences, including current, past and prospective customers. With product development surveys, professionals can:
- Gather general market research. Product development surveys are useful for gathering demographic data about your ideal customers, such as age and socioeconomic status.
- Screen ideas. Surveys are also valuable for screening new ideas, assessing market viability and determining demand before investing in product development.
- Test new concepts. Test design concepts or ad creatives with surveys to determine which option will perform better.
- Improve products in development. Surveys for product development provide insight that helps you tailor the new product and its features.
Surveys for product development are versatile and yield actionable, quantifiable data that you can benchmark and track. They are easy to use and quick to deploy, especially when you use survey templates. Check out our survey solutions for product marketers.
Product feedback survey templates and example questions
Marketing surveys are a tool to support your product development research. SurveyMonkey offers templates and sample questions for product feedback.
General market research
General market research collects broad data about a target market, purchasing behaviours and competitors. This insight helps businesses achieve their goals by giving them a clear understanding of their customers.
The following general market research surveys can help you gain a better understanding of your customers:
- Product-market fit. Product-market fit surveys help you identify your product’s target demographic and the features that your customers want.
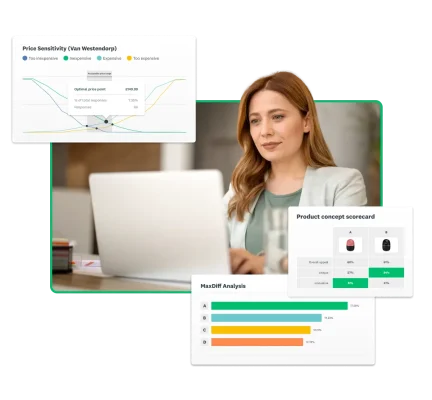
- Price testing. This survey assesses how much customers are willing to pay for similar products, which will help you determine a fair price point.
- Competitor research. Keeping track of your competitors is essential for understanding how to target your ideal customers more effectively. With competitor research surveys, you can explore how consumers view your offerings compared to your competitors.
- Online shopping attitudes. Assess how frequently your target customers shop online and their confidence in privacy features. Use these insights to evaluate their security concerns with online transactions and adjust your rollout strategy accordingly.
You can customise a Market Research Survey Template like the ones above to also ask your target market questions such as:
- Which of the following are reasons why you might purchase this product?
- If this product were available today, how likely is it that you would choose it instead of current competing products?
Idea screening
Idea screening helps product development and marketing teams validate products, messages and ad creatives. It involves presenting multiple concepts to your audience to determine their preferences. This can include prototypes, ad creatives, packaging design or early-stage products.
Idea screening surveys can help you:
- Identify winning ideas. Identify the most appealing concepts for your target demographic to determine which ideas you should advance and which you should discard. This ensures that only the products that resonate with customers are developed.
- Iterate on product design. Based on idea screening, you may refine your product design so it is more closely aligned with your target audience’s preferences.
The Messaging/Claims Testing Survey Template enables you to ask your ideal customers questions such as:
- Thinking about the claim overall, which of the following best describes your feelings about it?
- Does the claim provide too much information, too little information or about the right amount of information?
Concept testing

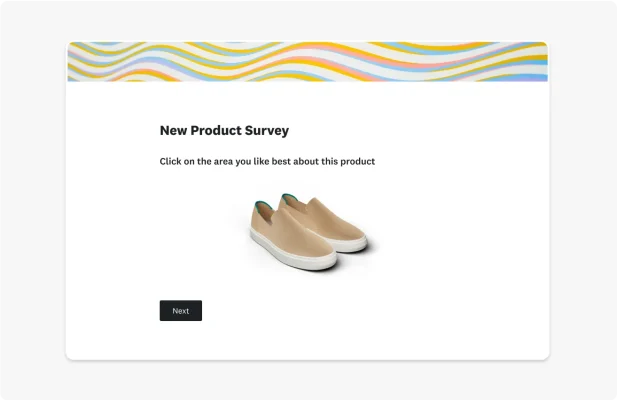
Concept testing, which is similar to idea screening, seeks feedback about more developed concepts rather than new ideas. Testing single or multiple concepts by means of A/B tests helps you to avoid mistakes and create products that customers really want.
Customise a Product Testing Survey Template to ask questions such as:
- When you think about the product, do you think of it as something you need or something you don’t need?
- What is your initial reaction to the product?
- How innovative is the product?
Feature development and improvement
Feature development and improvement surveys gather customer feedback to gain valuable insights into feature ideas and identify bugs that need fixing.
Consider working with your customer service team to identify product issues or suggestions. Collaborate on adding a question or two for product development into an existing customer service survey. Read more about customer service surveys in The ultimate guide to customer service.
If your product is software or an app, you can use a Software Evaluation Survey Template to ask questions such as:
- How satisfied are you with the security of this software?
- How satisfied are you with the account setup experience for this software?
- How likely is it that you would recommend this software to a friend or family member?
How to write good product feedback surveys
When it comes to product feedback surveys, the better your survey, the more reliable the results. To write good survey questions for product development, keep them short to minimise bias and promote higher engagement rates. Here’s how:
Set a goal for your product development survey
Setting a goal for your survey is necessary because it will allow you to refine the scope of the survey and gather actionable insights. Here some are tips for defining your goal:
- Test a few specific concepts. Test several product ideas, new features, etc. and ask respondents to choose a favourite. You could present concepts using simple descriptions, mock-ups or semi-detailed overviews.
- Choose one or two specific aspects of the product. Choose a couple of aspects to improve, asking questions such as “What would make this feature more intuitive?” or “Is this feature too complex, not complex enough or just right?”
- Solve a specific business problem. Answer questions such as “Why are customers cancelling our service after only a few months?” by sending a survey.
- Demystify a particular customer problem. If you run a video conferencing company, you might ask: “What aspects of video conferencing contribute to less focused meetings?” Your responses might include the term “background noise”, prompting your team to introduce a mute button.
Focused investigations can quickly give you a clear path forward. Surveys with broad questions such as “Do you like this?” often yield vague, unhelpful responses that don’t improve your understanding. Outline clear goals to focus your survey questions and identify areas for improvement.
Ask the right questions in the right way
Asking the right questions is crucial if you want obtain the feedback you need to improve your products. Your survey questions should correlate with your goal.
For example, your goal might be to identify a package design that appeals to customers. In this case, product survey questions about purchasing habits and behaviours may not be appropriate.
Here are a few tips to help you ask the right questions:
- Identify your audience in order to tailor your survey. Align your survey language with your target audience’s communication style.
- Include filtering questions for later analysis. Filtering questions disqualify respondents who are not part of your target audience and may skew the results.
- Don’t use jargon. Industry language may confuse respondents. Instead, use clear descriptions and known market names.
- Avoid bias. Give respondents the chance to use their own words with an ‘Other’ option or comment box.
- Keep your survey brief. Ideally, your survey should have 10 questions or fewer.
Tailor your survey to your audience
To ensure accurate survey results, it’s crucial to tailor your approach to your target audience. Here are some key strategies for creating a successful survey:
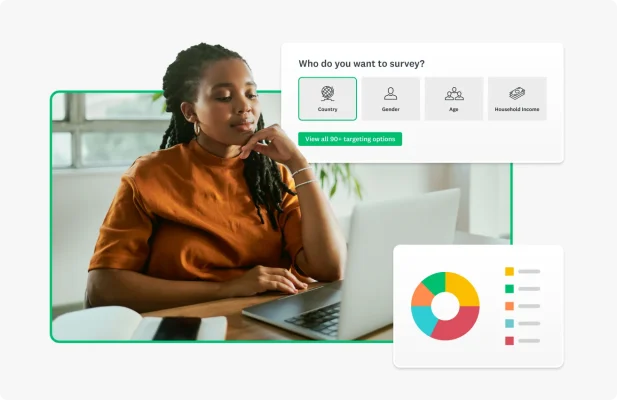
- Segment your audience. Segmenting your audience allows for more precise targeting and deeper insights. Tools such as SurveyMonkey Audience help you gather data that is specific to each segment. This includes potential customers, upsell-ready customers, certain age groups and full-time employees.
- Avoid jargon. Use clear, straightforward language to prevent confusion and ensure that respondents fully understand the questions.
- Choose the right medium. Deliver your survey via channels that your audience frequently uses. This could be email, social media or your business website.
Rely on customisable questions and templates
When time is limited, creating product development surveys from scratch may not be feasible. SurveyMonkey offers Product Development Survey Templates to streamline the process of gathering customer feedback, which will help you to refine your concepts.
If you’re uncertain where to begin, the SurveyMonkey Question Bank offers hundreds of pre-written questions. These questions can help you easily craft effective surveys.
When to fit surveys into your product development cycle

Knowing when to incorporate surveys into your product development cycle is crucial. Key moments include:
- Planning new features or products. Surveys are valuable when collaborating with product teams to plan a product roadmap or prioritise new features.
- Validating big ideas or concepts. Before investing resources, use surveys to validate new concepts.
- Post-collaboration feedback. After working with stakeholders, surveys can address specific insights into or questions about your products and features.
- Responding to usage declines. If you notice a drop in product usage, purchases or repeat customers, surveys can help identify the cause.
- Gaining competitive insights. Competitive differentiation surveys can further refine your understanding of customer preferences.
How to analyse survey feedback and take action
Analysing survey feedback is as crucial as setting goals and crafting the survey.
Helix Sleep, a mattress company, used SurveyMonkey product development solutions for concept testing. It leveraged SurveyMonkey Audience to understand the sleeping habits of its target audience.
Helix Sleep used research to develop the Helix Pillow, ensuring that it corresponded with their target market’s needs and price point. They found that 40% of consumers buy pillows with mattresses, thus highlighting key market segments to target.
As was the case for Helix Pillow, your analysis can yield actionable steps to aid your product development. Consider the following tips before analysing your data.
- Weight your surveys. Weighting surveys for market research adjusts your sample to more closely reflect the broader consumer population of interest.
- Clean your data. Exclude incomplete responses and those that don’t meet your target criteria in order to avoid skewed results. Also, remove ‘straightliners’ as they may not provide reliable feedback.
- Use filters. Filters refine raw data, allowing a deeper analysis of specific aspects. You can filter according to question or answer, or completeness to view complete responses.
- Apply compare rules. Compare rules allow you to select and view multiple answer options from a single question side by side. This feature helps you analyse responses across different age groups.
- Create tags. Use tags to categorise open-ended responses by creating rule-based tags or manually tagging.
- Leverage Sentiment Analysis. Sentiment Analysis organises text responses to reveal underlying emotions. It can be used on all open-ended text except multiple textboxes.
Get started with SurveyMonkey for product teams
Make your product launch a success! Product development surveys are a vital research tool for successful product development. They help you identify winning ideas and determine which features to prioritise on your product roadmap.
SurveyMonkey offers solutions for product teams that empower them to design better products. Sign up today to start creating surveys.
NPS®, Net Promoter® and Net Promoter® Score are registered trademarks of Satmetrix Systems, Inc., Bain & Company and Fred Reichheld.
Ready to get started?
Discover more resources

Solutions for your role
SurveyMonkey can help you do your job better. Discover how to make a bigger impact with winning strategies, products, experiences and more.

How to Develop Market Positioning That Sets You Apart
Market positioning helps businesses to differentiate themselves and attract the right audience. Discover its types and steps to take to build a strong presence.

Hornblower enhances global customer experiences
Discover how Hornblower uses SurveyMonkey and powerful AI to make the most of NPS data, collect customer insights and improve customer experiences.

Shaping the future: how British values in the workplace drive inclusion and engagement
Discover how ‘British values in the workplace’ surveys can reveal what matters most to employees, fostering inclusion and engagement.