Net Promoter Score pros and cons: Why use NPS?

What do customers really think of your brand or products? Do they like you enough to recommend you to their friends? How likely are they to purchase from you again?
As a customer experience (CX) professional, these are crucial topics. After all, if customers aren’t satisfied with the service they received or don’t like your products, the chances are that they won’t be repeat customers.
To top it off, with the ease of social media reviews, they could instantly share a negative experience with hundreds or thousands of people. As you’re probably already well aware, it’s definitely in your best interest to understand your customers’ opinions and quickly address gaps that are causing dissatisfaction.
That’s where the Net Promoter® Score (NPS) comes in. In this article, we’ll explore the pros and cons of NPS and touch on the following areas:
- Why is Net Promoter Score important?
- Advantages of NPS
- Disadvantages of NPS
- NPS alternatives
- When to use NPS versus Customer Satisfaction (CSAT) Score
Net Promoter Score: Pros and cons
A simple way to understand your customers’ level of loyalty is to send out a Net Promoter Score (NPS) survey to your customers. The NPS system measures customer satisfaction and gauges whether customers like your company as well as whether they’d tell their friends about it.
It does this by asking one core question: “How likely is it that you would recommend [Organisation X] to a friend or colleague?”
Customers rate their answers on a 0–10 scale. You then divide this scale into three categories: ‘detractors’, ‘passives’ and ‘promoters’.
- Those who give a 0–6 rating are detractors.
- Those who give a 7–8 rating are passives.
- Those who give a 9–10 rating are promoters.
You can work out your NPS by using the simple Net Promoter Score calculation, NPS Calculator, or by using this formula:
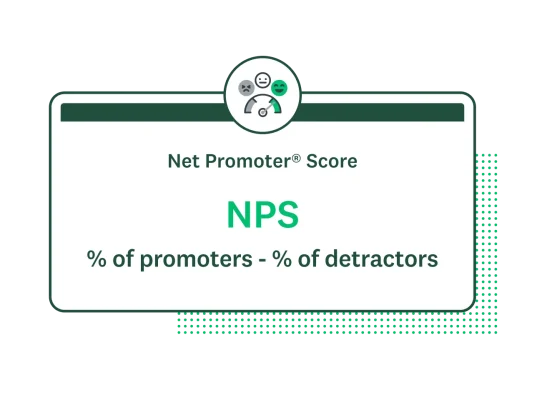
When you use our NPS Survey Template, we calculate your Net Promoter Score so you can file away that spreadsheet or track it in Salesforce and put your energy into a follow-up plan.
Related reading: NPS surveys: Best practices for high response rates
Why is NPS important?
The NPS gives you the tools necessary to track customer satisfaction and implement strategies to improve it. The NPS question essentially asks customers if they have a positive experience with your brand. Those who respond highly have had a wonderful time with your business and are more likely to recommend you to a friend.
While all forms of marketing have their place, one that’s constantly overlooked is word of mouth. In fact, 57% of customers say they would stop doing business with a company if a friend told them they had a bad experience. Understand your audience with NPS; create a better customer experience; and iterate upon it time and time again.
Understanding the significance of NPS
Customer loyalty and satisfaction are two leading aspects of running a successful business. Yet quantifying something as abstract as enjoyment can pose a challenge for many companies. That’s where NPS comes in.
The NPS demystifies customer satisfaction with an incredibly simple question. Instead of collecting hundreds of various responses to try to understand what your customers feel, the NPS condenses everything down into a single question.
Businesses can use the NPS to get a simple, quantifiable and benchmarkable figure that represents customer loyalty and satisfaction. Once a company has this initial figure, it can begin to implement changes and measure their impact on CX.
As you repeatedly measure NPS, you can see how internal changes have an impact on your customers. Over time, you’ll be able to create a winning customer experience across every touchpoint.
Advantages of NPS
Let’s start off by examining the positive aspects of the NPS system and look at ways in which it can help your company if you apply the findings to your business practices.
Simplicity
One leading advantage of the NPS is how simple it is to create, send out and understand.
The NPS online poll does not require a statistician to administer it. The example survey question uses one main idea: whether your customers like your company enough to recommend it. It often includes a few follow-up questions to help you understand why people would recommend/would not recommend your brand.
You can easily send it out to customers via email or post it on your website, and the calculation formula is intuitive and only requires a basic spreadsheet to calculate. Alternatively, if you use the SurveyMonkey NPS template, we’ll handle the maths for you!
Related reading: Learn how to calculate your Net Promoter Score
Benchmarking
A key component of the NPS programme is that it’s a standard measurement used by companies worldwide, so you can easily benchmark your Net Promoter Score and see where you stand against your biggest competitors. Your score gains relevance in the context of other scores within your industry.
For example, if your NPS is 61 but your industry average is 70, you know that, relative to your competition, you have some work to do. Alternatively, if your score is 70 but your competitors all have scores in the low 60s, you know that your customers enjoy your company.
Having a high score doesn’t mean it’s time to get comfortable. On the contrary, achieving a high NPS is an opportunity to send out another survey and ask your promoters how you can improve your business.
This approach shows customers you care about meeting their needs even after they’ve purchased your product or service. It also inspires your promoters to remain promoters and not slip into the passive category.
Related reading: Improve customer loyalty and retention
Actionability
When you ask for additional information to outline why a customer responded to your NPS in a certain way, you unlock a range of data that can provide powerful, actionable insights.
NPS feedback offers actionable insights pinpointing areas that your business can improve upon. For example, maybe customers show lower satisfaction with a specific product. By investigating this relatively lower NPS, you can find out how to improve that product.
Over time and with continuous improvement, you can enhance every aspect of the customer experience. The actionable insights that you can draw from the NPS can chart your course towards success.
Predictive power
The NPS isn’t just a great measure of customer loyalty; having high marks can also lead to business growth. Numerous studies have found that there is a strong correlation between high Net Promoter Scores, repeat purchases and increased revenue.
SurveyMonkey research shows that 40% of CX professionals use the NPS to improve their revenue. The research suggests that when companies use NPS as a key metric, it helps drive business growth as the company becomes more focused on improving the score.
NPS is a great way to monitor your business’s health regarding customer satisfaction and internal operations. A high NPS score closely correlates to:
- Repeat purchases
- Higher likelihood of word-of-mouth recommendations
- Decisive business growth
- Profitability
- Improved brand advocacy
- Higher customer loyalty
When you focus on improving NPS, you’re actively improving the customer experience and winning customers for life.
Disadvantages of NPS
As you can see, there are many pros of the NPS. However, several disadvantages are important to acknowledge.
Let’s take a look at some of the Net Promoter Score cons.
Lack of context
Critics of the Net Promoter Score say that although it may help you understand customer loyalty, it doesn’t specifically identify why your customers may be detractors.
To understand why your customers don’t like certain aspects of your company, make sure you follow up with more specific market research surveys or customer satisfaction surveys. Sending out the NPS survey is a great first step to understanding customer loyalty. But to really make the NPS system effective, you need to have a follow-up plan.
Let’s suppose your scores come back really low. What’s your next step? Will you send out more detailed surveys to pinpoint the issues? Do you have the resources in place to fix the broken logistics that may be leading to customer dissatisfaction?
You can always find solutions when you ask the right questions. Equally, you can also create more specific, transactional NPS surveys that ask whether a customer would recommend:
- Your company
- A product
- A service
- Your customer support chat
- Any customer touchpoint
Research sample survey questions and examples to help build your next NPS survey. By providing as much additional context as possible and coupling the NPS with further questions, you can overcome this disadvantage.
Related reading: How to follow up with NPS detractors, promoters and passives
Overemphasis on promoters
Another disadvantage of the NPS is that it can disproportionately focus on promoters. Although promoters are an important part of the puzzle, businesses also need to also look at their passives and detractors.
Some companies may completely overlook passives. Their approach may favour improving services for the detractors and further increasing loyalty with promoters. Although this is one course of action a business can take, it doesn’t give a clear picture of the overall customer loyalty in your business.
Although it’s easier to focus on the promoters, as you want as many as possible, don’t forget about your other customer classifications.
You can always follow up on your NPS survey to get more information from detractors and passives. If you close the feedback loop and improve areas they did not enjoy, you could convert them into promoters in no time.
A great NPS survey is much more than just the top of the scale. Listening to your promoters, passives and detractors is vital for success with this customer loyalty metric.
Related reading: How to turn NPS detractors into promoters
Cultural variations
Customer expectations and experiences vary across the globe. With different cultural norms and ideas around the world, your NPS scores could look very different depending on where you are. This is particularly the case if you’re an international business that works out of more than one country because you need to pay attention to how NPS can change in different locations.
The NPS of consumers in different countries varies radically, according to a SurveyMonkey report, Worldwide NPS revealed. For example, consumers in Brazil and India are extremely satisfied with their companies. On average, these countries received an NPS of 62 and 51. Industry experts consider anything over 50 to be excellent, so the average consumer in these countries is very satisfied.
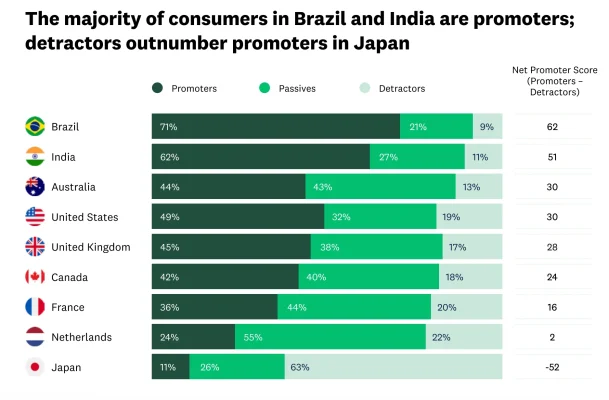
At the opposite end of the spectrum, consumers in Japan average a Net Promoter Score of -52. This figure is considered low in any industry, demonstrating just how much NPS can vary across the globe.
Ultimately, SurveyMonkey research demonstrates that the key driver can vary by country. For example, quality is the key NPS driver in the United States whereas innovation is the key driver in Japan. France considers ease of use to be the most important factor, whereas Australia believes that design comes first.
Understanding how your NPS score can change in relation to cultural contexts will help you overcome these differences.
Net Promoter Score alternatives
It’s best practice to use NPS in tandem with other leading loyalty metrics to contribute to a successful Voice of the Customer (VoC) programme. Here are some other Net Promoter Score alternatives that you can use to measure customer pain points, loyalty and satisfaction.
Customer Satisfaction (CSAT) Score
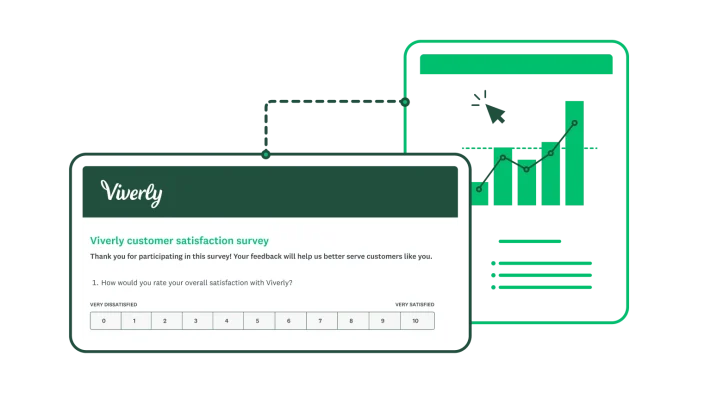
The Customer Satisfaction (CSAT) Score is another leading customer loyalty metric that tells businesses how satisfied customers are with their services. Getting started with CSAT is straightforward. The survey asks customers to quantify their satisfaction with your brand, typically on a 1–5 scale.
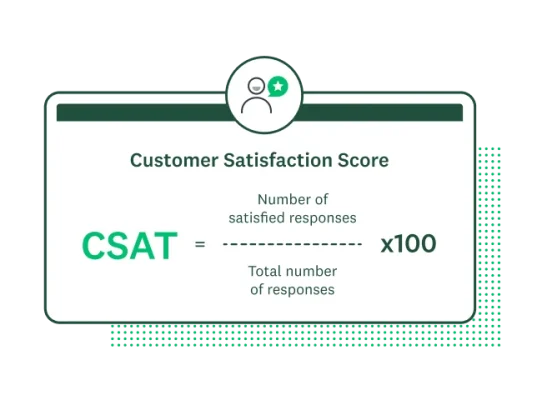
You can calculate your overall CSAT by working out the number of happy customers (4 or 5s) and dividing that figure by the total number of respondents x 100.
CSAT is a popular customer experience metric, meaning there are industry benchmarks that you can use to compare. The UKCSI website offers biannual benchmarks, helping your business determine where you stand compared to others in your industry.
Using the CSAT metric, you can:
- Improve customer touchpoint management
- Enhance customer satisfaction
- Identify poor customer experiences
- Fix pain points in the customer journey
- Increase revenue and decrease customer churn
As a valuable metric that demonstrates customer loyalty and satisfaction, CSAT is a powerful alternative to NPS.
Learn more about Customer Satisfaction Score by reading our ultimate guide or create a survey using a SurveyMonkey CSAT template.
Customer Effort Score (CES)

Customer Effort Score (CES) helps businesses measure how easy a customer interaction is. This CX metric helps to identify friction in customer touchpoints. It aims to better understand challenges to the customer experience in order to give a company insight into where they can make improvements.
The Customer Effort Score is often measured against customers’ expectations.
It asks “How easy was it for you to [Add Task/Action]” and offers the following answer options:
- Much easier than I expected
- A bit easier than I expected
- About as easy as I expected
- A bit more difficult than I expected
- Much more difficult than I expected
You can then couple this question with an open-ended question, asking “What would have made it easier?” to understand CES.
Tracking Customer Effort Score will help your business to minimise customer effort and maximise satisfaction. By using CES surveys across your most important touchpoints, you can identify areas where you need to streamline the process.
Get started with the SurveyMonkey Customer Effort Score template.
Purchase feedback
Your checkout window is one of the most important pages on your site. If customers have an issue with paying, or they’re unable to complete their transaction, your business won’t bring in any capital. Plus, 81% of customers will share a poor experience with their family and friends, so making improvements to your purchase process should be a top priority.
The best way of assessing the purchase experience is to collect purchase feedback. Purchase feedback launches rapid surveys that appear on-screen after a shopper has completed checkout.
Customers can quickly offer feedback about how easy their purchase process was, highlighting any errors or areas of friction. Your business can then quickly turn this data into actionable insights to improve your checkout. Over time, this will enhance your customer experience and help to improve customer satisfaction.
Customer service feedback
Customer service is one of the most important factors at play when trying to increase and sustain customer satisfaction. Around 90% of consumers say that customer service is an important factor in their favourite brands.
Customer service feedback allows your customers to rate their support experience. They’ll answer whether or not the agent was able to resolve their problem and rate their efficacy. You can even automate this process in order to gather feedback from your customer service team when certain actions are taken (e.g. when a support ticket is marked as ‘closed’).
You can then turn this data into insights to quickly spot any trends and patterns in your data. Alongside identifying areas for improvement in your closed-ended questions, you can analyse open-ended text to find actionable insights.
Better customer service will result in less customer frustration and boosted loyalty.
Related reading: 5 tips for improving customer service and driving retention
Drive continuous CX improvement with SurveyMonkey
Overall, the NPS is an effective method of measuring customer loyalty. It gives companies a comprehensive insight into how their customers feel about them and their offerings.
While the NPS has cons, like its lack of context or cultural variations, you can overcome these with effective planning and research. By measuring, monitoring, and improving upon the actionable insights that your NPS delivers, you can create better customer experiences across the entire customer journey.
There’s a reason why the NPS is such a widespread metric. It’s one of the most effective customer experience metrics you can turn to. If you’re not using NPS, there’s never been a better time to begin. Get started with our free, expertly designed NPS survey template today!
Discover more resources

Customer satisfaction survey templates
Explore our customer satisfaction survey templates to rapidly collect data, identify pain points and improve your customer experience.

See how Ryanair collects customer insights at scale
Discover how Ryanair uses SurveyMonkey and its Microsoft Power BI integration to track 500k monthly CSAT surveys and improve customer experiences.

How to identify customer needs
Refine your market research approach with our guide to identifying customer needs and what UK shoppers are looking for in 2024.

See how woom enhances its employee and customer experience
Discover how woom uses SurveyMonkey to launch multilingual surveys at scale, improve the employee experience and capture customer insights.
See how SurveyMonkey can power your curiosity
Net Promoter, Net Promoter Score and NPS are trademarks of Satmetrix Systems, Inc., Bain & Company, Inc. and Fred Reichheld.