Top customer service metrics and rating scales explained
Learn how to measure customer service and get the most out of your data. Ready to start collecting customer feedback? Use a template to create and send a survey in minutes.

According to our SurveyMonkey 2023 State of CX Report, 90% of consumers say customer service and support are important for the brands they like.
In fact, more than half (57%) say they’d stop doing business with a company following a poor experience. It’s scary, isn’t it? The good news is that customer service is one channel that you can control and measure more easily than others such as social media or word of mouth.
And customer service makes a difference. Only 2% say customer service and support aren’t important at all.
So, how can you meet (and even exceed) customer expectations? The first step is to make sure you’re paying attention to the customer service metrics that matter.
In this article, you’ll learn about customer service metrics that companies use to evaluate success. You’ll also see customer service rating scale examples that enable reliable data to be gathered.
Customer service vs. customer experience
When professionals refer to the customer experience (CX), they mean the entire customer journey, from brand discovery to purchase and beyond. It’s every interaction a customer has with your organisation across every channel as well as their overall impression of your brand.
Customer service is one aspect of the customer experience. It’s how your organisation directly supports both prospective and current customers. The goals of a customer service team are to answer customer questions and resolve issues quickly, efficiently and with care.
Organisations use customer experience metrics to proactively track brand loyalty, customer satisfaction, consumer sentiment and more. Some of these metrics are specific to customer service, which is more reactive versus proactive.
Related reading: Your guide to running a customer feedback programme
Top customer service metrics
There are two types of metrics that you can use to understand your customer service performance. First, you can collect customer feedback by sending customer satisfaction surveys to customers after they’ve interacted with your support team. The feedback that you collect is subjective, even if it yields quantifiable data.
The second type of customer service metrics that you can track are your input metrics, such as how long it takes your service agents to respond to customer requests. By analysing your agent performance metrics with the feedback from customers, you can gain a comprehensive understanding of how well your customer service is meeting customer expectations and where the customer service can be improved
Here are the different types of customer feedback metrics and inputs that customer service teams use to evaluate their performance.
Different types of customer service feedback metrics
Net Promoter Score (NPS)
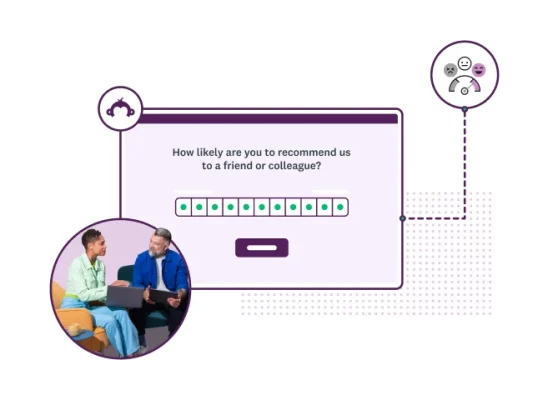
You may be familiar with the Net Promoter® Score (NPS) question: “How likely is it that you would you recommend this company to a friend or colleague?” Customers choose a number from 0 (not at all likely) to 10 (extremely likely). Your results show how loyal customers are to your brand.
You can send a Net Promoter Score survey at any point in the customer experience. The NPS question works well in different contexts because it’s usually not tied to one specific event.
When you ask the NPS question in a customer service feedback survey, you’re able to understand how your support may have an impact on customers’ loyalty to your brand.
How to calculate NPS
When you send a SurveyMonkey survey that includes the NPS question, your score is calculated for you. If you need to calculate your own score, you can use an NPS calculator. Here’s how it works:
- Customers who choose 0 to 6 are detractors. Their opinions may harm your brand image.
- Customers who choose 7 or 8 are passives. They’re satisfied but may not stay loyal to your brand.
- Customers who choose 9 or 10 are promoters. They’re the most satisfied and may recommend you to others.
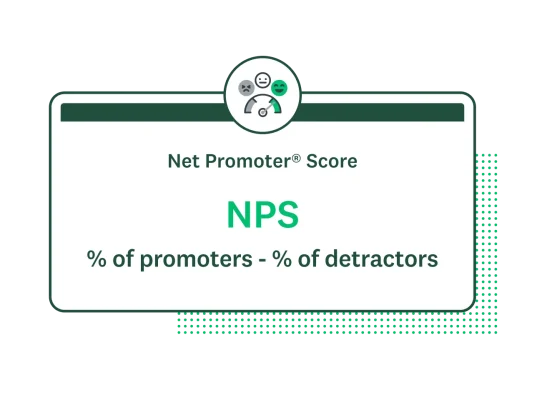
- Passives aren’t included in your NPS. Work out the percentages of promoters and detractors you have from your total number of respondents and then use the formula % of promoters - % of detractors = NPS.
- Your NPS can range from -100 to +100 and NPS customer service benchmarks differ by industry. For example, the average score for the ecommerce industry is 62, whereas it’s 4 for internet and software services. See how you compare to others in your industry with Net Promoter Score benchmarks.
- NPS provides a quick snapshot of your team’s performance. It’s one number you can easily track over time. If you see the number consistently decreasing, it’s time to dig into the data.
- Include an open-ended survey question asking customers why they gave you a particular rating. For example, if someone gives you a 6, include the follow-up question: “What changes would this company have to make for you to give it an even higher rating?” You can look at individual responses or use a powerful text analysis tool to quickly understand data trends.
Customer Satisfaction (CSAT) Score
While you should use NPS to understand your team’s impact on customer loyalty, you need the Customer Satisfaction (CSAT) Score to measure how well your team is supporting customers. (Read more about when to use NPS vs. CSAT.)
There are many different examples of customer satisfaction questions. For a customer service survey, ask a question such as: “How satisfied were you with the response time of our customer support team?”
Customer satisfaction survey answers are usually on a scale of 1 (extremely dissatisfied) to 3, 5 or 10 (extremely satisfied). To get your CSAT score, you only consider customers who are satisfied with your customer service.
How to calculate the Customer Satisfaction Score
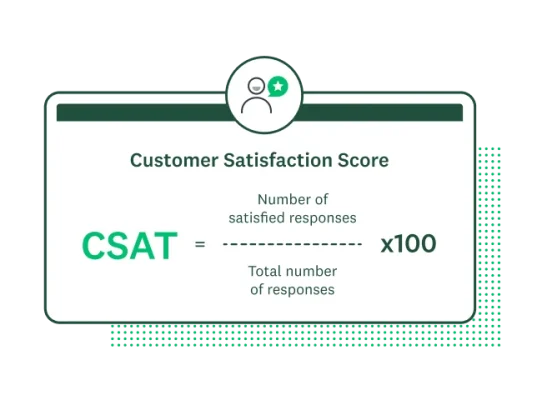
Calculate CSAT by dividing the number of satisfied customers by the total number of respondents and multiplying by 100.
- You can rely on customer satisfaction survey templates to get reliable results. If people aren’t taking your surveys, it could be because you’re not following customer satisfaction survey best practices.
- What’s a good CSAT? The American Customer Satisfaction Index (ACSI) measures customer satisfaction across the US economy. In 2022/2023, the overall US Customer Satisfaction Score was almost 76%. However, CSAT differs by industry, so you’ll need to check yours against ACSI benchmarks.
- Use the data from your CSAT surveys to prove the ROI of customer satisfaction.
Customer Effort Score (CES)
Our research shows it’s likely that 91% of consumers will recommend a company after a positive, low-effort experience. The Customer Effort Score (CES) measures how easy or difficult it is for customers to achieve tasks when interacting with your product or service.
For example, in a Customer Effort Score survey, you could ask: “How easy was it for you to resolve your recent issue with our customer support?” Answer choices can range from “Much easier than I expected” to “Much more difficult than I expected”.
Your resulting CES will be between 0 and 100, which shows the total number of customers who respond positively to the question.
How to calculate the Customer Effort Score
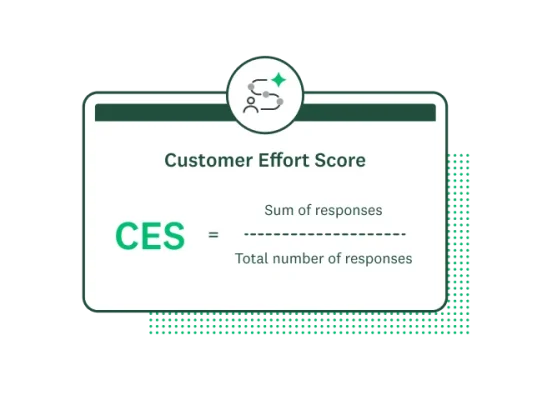
To calculate CES, divide the sum of the responses by the total number of responses.
- You can calculate your CES for any type of customer service interaction, such as phone, email, social media, chat and in-person support.
- Why should you care about CES? You can significantly improve your customer service by working out exactly what is frustrating customers the most.
- Just like NPS, the Customer Effort Score is one number. You should track it over time but also make sure you’re collecting open-ended feedback so you can understand why customers gave you the rating they did. Learn more about how to use CES.
Customer service metrics: Examples of inputs
First response time (FRT)
Also known as first reply time, first response time (FRT) measures the average time a customer service agent takes to respond to a customer request or ticket.
How to calculate first response time
(Total first response times / Total number of resolved tickets) x 100 = FRT
- FRT differs by industry, product and channel. For example, it generally takes organisations longer to respond to emails than a phone call. It can be difficult to understand what’s considered to be a good FRT. A good place to start is the Customer Service Quality Benchmark Report, which shows that the average FRT for 2023 is 4 hours and 42 minutes.
- Our 2023 State of CX Report shows that 80% of consumers expect a response to customer service requests within one business day.
- Use automated responses to let customers know that you have received their request and will get back to them soon. This doesn’t replace an actual reply, but you can set customers’ expectations in terms of how long they may have to wait and give them confirmation that their request went through.
Average handling time (AHT)
How to calculate average handling time
Total handling time / Total number of calls = AHT
*Total handling time includes total talk time, total hold time and after-call work
- AHT differs by industry and this Talkdesk 2021 Global Contact Center KPI Benchmarking Report doesn’t include after-call work in their calculation of AHT. But you can get a good idea of industry benchmarks such as healthcare (3 minutes, 11 seconds) or retail, ecommerce and consumer goods (3 minutes, 29 seconds).
- Remember that AHT is only part of the picture. Although it’s generally better to have a lower AHT, it’s a good idea to benchmark against yourself, too. You may only have service agents working on the most complex cases, while AI or chatbots resolve simpler cases.
- You can reduce AHT by ensuring that your service agents are well trained and have short, clear scripts to help them resolve common issues. It’s also a good idea to create checklists for your service agents so they can be consistent and efficient when responding to tickets.
Other common customer service inputs to track
First contact resolution: This is the percentage of customer service requests and calls that are resolved during the first customer interaction.
Time to resolution: The average time it takes for your service team to resolve a customer request or issue.
Average ticket touches: Also known as replies per resolution or replies per ticket, this metric shows the average number of times your service agents respond to a request or ticket.
Tickets resolved: This metric helps you see how many of your customer support tickets are resolved. You can compare this to how many open tickets you have at any given time.
Ticket reopens: The percentage of support tickets that customers reopen after the tickets are resolved. When a ticket is reopened, it shows that a customer’s issue wasn’t resolved to their satisfaction. Your ticket reopen rate can help you understand how effective your customer service is.
Cost per resolution: What is your average cost of resolving a support ticket? Choose a period of time and assign a cost to all of your operating expenses (salaries, tools, etc.). Then divide that by the number of tickets you received during that time.
The ultimate guide to customer service
Learn how to improve your support by mastering de-escalation tactics, asking better customer feedback questions and more.
How to measure customer service
There are different methods you can use to measure customer service. If you’re running a Voice of the Customer programme, you’ll be paying attention to customer feedback across your customer experience, from social media to purchase feedback.
Using Customer Relationship Management (CRM) software such as Zendesk, you can see key customer service metrics and customer feedback. You can even integrate Zendesk with SurveyMonkey to easily map feedback to customer records, send surveys to segmented customer lists and automate customer service surveys.
Different dimensions for rating customer service
There’s a reason why there are so many types of customer service feedback surveys and metrics: each organisation has its own definition of what a great customer experience looks like; and customers, too, have their definition of what a great customer experience looks like.
Your customer service team can’t control the entire customer experience. But you can tap into the five dimensions of service quality that matter most to consumers.
- Tangibility: How does your physical facility look? Are your equipment, employees and communication materials polished and professional?
- Reliability: Can customers depend on you to help them when they need support?
- Responsiveness: How willing are you to give prompt support to customers? Are you answering quickly enough? How quickly do you answer customer questions and follow up?
- Assurance: How much confidence do customers have in your expertise?
- Empathy: Do customers think you really care about them and their needs? Are your service agents responding with kindness and understanding?
Get to know these dimensions of service quality and then make sure you’re covering the areas that make sense for your organisation and team. This will help you choose the right questions and the most important metrics to focus on.
Customer service scores explained
You know how to collect different metrics and which topics you should be covering to find out whether you’re exceeding customer expectations. But how do you know what to ask in your customer service surveys to get reliable results?
Remember that customer service feedback questions are more than the questions themselves. The answer options, or the responses that generate your customer service scores, matter. Here’s an example:

Keep reading for an overview of different customer service rating scales, including when to use numbers and words and how many answer options to provide.
Choosing an effective customer service rating scale: Examples
Number of answer options
Let’s suppose you called customer service to request help with setting up a new mobile device. You had to wait more than 20 minutes to get in touch with someone, but once you did, they were helpful and mostly able to resolve your issue. (You’ll have to take a few extra steps to get your device to start working.)
After the call, you receive a survey that asks: “Overall, did you have a positive customer service experience?” You see two answer options: Yes and No.
How would you answer? The customer service agent was extremely helpful, empathetic and took the time to resolve your issue. But you had to wait a long time to talk to someone and are unhappy that you couldn’t complete the setup over the phone. So you choose “No”.
What does this customer feedback tell the company? In this context, not much. It would probably be in the company’s best interests to provide answer options that follow a 5- or 7-point rating scale, such as the Likert scale.
Overall, how satisfied or dissatisfied are you with the customer support you received?
- Very satisfied
- Somewhat satisfied
- Neither satisfied nor dissatisfied
- Somewhat dissatisfied
- Very dissatisfied
This 5-point scale allows for a neutral answer option and a more nuanced understanding of an experience’s positivity or negativity level. To turn this into a 7-point scale, add “Extremely satisfied” and “Extremely dissatisfied” to both ends of your list of answer options.
Numbered vs. worded scales
“On a scale of 1 to 10, rate your experience with our customer service.”
Many people recognise 1 (bad) to 10 (good) as a standard numeric rating scale. And the numbers’ value can directly translate to customer service scores.
That said, a numbered scale can be subjective and leave customer sentiment somewhat of a mystery. Customers may avoid numbers at either extreme, and numbers in the middle may not tell a service team much at all about their performance.
Worded scales give people a better opportunity to think about their own experiences and try to choose the most accurate description.
How responsive or unresponsive were our customer service agents?
- Very responsive
- Somewhat responsive
- Neither responsive nor unresponsive
- Somewhat unresponsive
- Very unresponsive
When it comes to numbered vs. worded scales, you can combine numbers and words to give respondents a good idea of scale and what those numbers actually mean. The NPS survey question is a good example of this. It includes a 0 to 10 rating scale but qualifies each end with “Not at all likely” and “Extremely likely”.
Pain scales
Besides words or numbers, more organisations are using emojis for their customer satisfaction rating scales. The smiling, neutral and frowning faces were originally developed as a pain scale for healthcare. Patients point to the face that best represents their pain level, while practitioners can correlate this to a number to measure the severity of the pain.
You can also use pain scales for customer service satisfaction. Emojis can be helpful because they’re an easy visual cue that often translates well across languages and cultures. Plus, people may be more inclined to take the time to respond if they don’t have to read too many answer options or think too much about the number they want to assign to their experience.
Similar to emojis, you can use star ratings to ask customers about the effectiveness of your service, help articles and more.
Tips for getting the most out of your customer service rating system
- Use different channels to offer customer support, including self-service options. When you engage with customers via their preferred communication channel, they’re more likely to have a great experience.
- Your customer support is only as good as your employees. Ensure that employees are engaged and feel they can grow in their role. Offer employee training and continuing education opportunities.
- Incentivise your employees to perform at their best. Reward your top-performing service agents. You can evaluate your service agents through customer feedback and see how their performance metrics compare to others. For example, Agent A might resolve tickets faster than Agent B. That said, you’ll want to look at all the data for the complete picture. (Even though Agent B takes longer to resolve tickets, they might have a much higher customer satisfaction score.)
- Use your customer service interactions as an opportunity to gather testimonials and customer stories for your company.
- Having trouble getting customers to take your surveys? You can increase your customer satisfaction survey response rates by asking the right questions, keeping your surveys concise and optimising them for mobile devices (to give just a few examples).
- Learn about the common pitfalls of customer service teams. Then look at these tips for improving your team’s customer service skills.
Get the insights you need to exceed customer expectations
See how SurveyMonkey can help improve your customer satisfaction with our expert-written customer feedback surveys. Easily create and send a survey in minutes to start taking action today.
Discover more resources

Customer satisfaction survey templates
Explore our customer satisfaction survey templates to rapidly collect data, identify pain points and improve your customer experience.

How to identify customer needs
Refine your market research approach with our guide to identifying customer needs and what UK shoppers are looking for in 2024.

How the SurveyMonkey Salesforce integration helps you improve CX scores
How to combine the power of Salesforce customer data with the feedback capabilities of SurveyMonkey to improve CX.

Get feedback you can act on with online evaluation forms
Unlock the power of feedback with SurveyMonkey's online evaluation forms. Start with our form builder today!
See how SurveyMonkey can power your curiosity
Net Promoter, Net Promoter Score and NPS are trademarks of Satmetrix Systems, Inc., Bain & Company, Inc. and Fred Reichheld.